
Protein per bar, not per 100 grams
Conversion +47%
The brand's nutrition was excellent and stated in a unit nobody in the category compares on. Shoppers scanning a results page could not tell it apart from a snack with half the protein.

At a glance
- Category
- Snack Foods
- Marketplaces
- US
- Revenue at start
- $97k / month
- Origin
- European brand, metric labeling conventions
- Engagement
- Creative & content + listing SEO
- Timeframe
- 6 months
Results
The challenge
Every competitor on the results page led with a single number stamped on the pack: grams of protein in one bar. The brand led with a per-100-gram table, carried straight across from its home market, where that is the convention shoppers read — the compliant per-serving panel existed on the export pack, but nothing in the listing imagery or the copy used it.
On a phone-sized search result, this is not a labeling nuance — it is the entire comparison. A shopper deciding between six thumbnails is comparing one number, and the brand was not showing it. Worse, per 100g its figure was larger and therefore looked like a different measure entirely, so the few shoppers who read carefully suspected the claim rather than believing it. The product was genuinely competitive on protein and sugar and was losing to snacks it beat on both.
Our approach
We restated the same facts in the unit the category is shopped in.
- Per-bar figures in the title and on frames two and three, with the number also printed on the pack the main image shows — the main image itself can carry no added text, and the full panel keeps its own frame for anyone verifying a claim.
- The two numbers this shopper screens on — protein up, sugar down — carried on frames one and two rather than buried in the fourth image.
- Keyword work on nutrition modifiers, a vocabulary the listings had never contained because the copy described taste and provenance.
- A comparison module in A+ using the same per-serving unit across the brand's own range, so the multipack choice is a decision rather than a guess.
How we worked
- 1
Reading the shelf
Twenty competing results captured as a shopper sees them: every one led with a per-serving figure, none with a panel.
- 2
Restating the panel
Every SKU's nutrition converted to per-bar figures and verified against the certified analysis before anything was published.
- 3
Rebuilding the image stack
Frames two and three rebuilt around protein and sugar per bar; taste and ingredient story moved back to frames four and five.
- 4
Nutrition keyword map
Protein, sugar, fiber and calorie modifiers researched and written into titles, bullets and backend terms.
- 5
Reading the shelf again
The same twenty competing results re-captured after launch to confirm the brand now leads with the number they do.
Inside the ad account
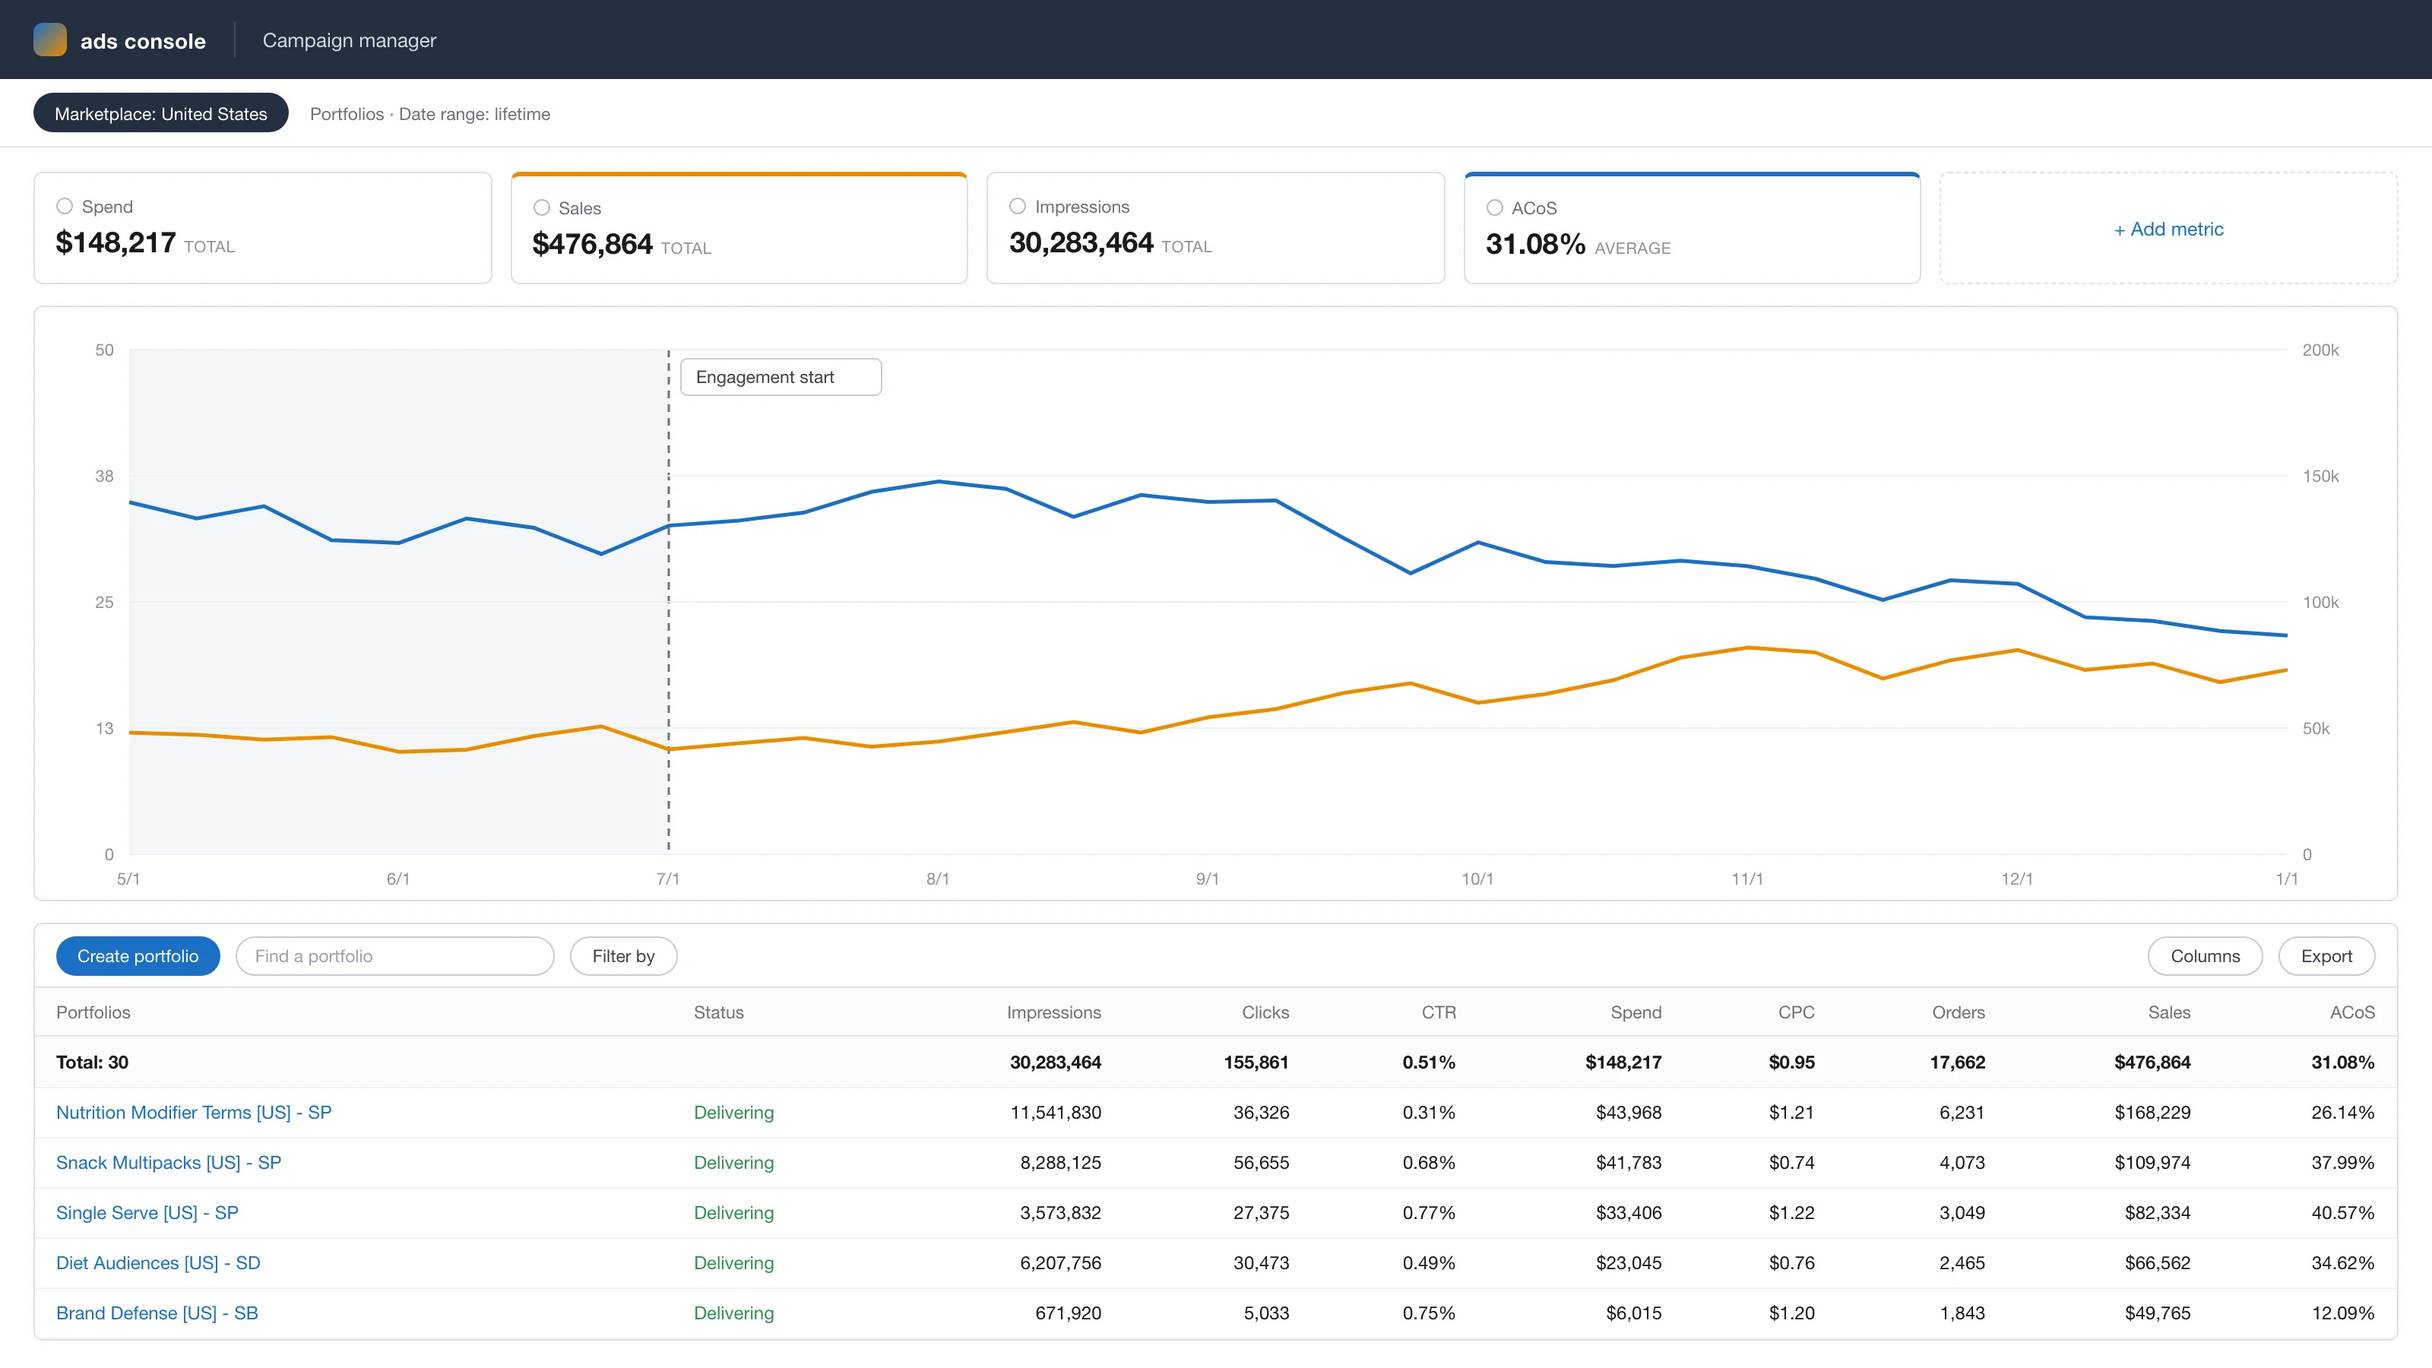
Anonymized account view, rebuilt from the figures reported above: ad sales growing from $44k to $76k a month while ACoS falls from 33% to 24% across the 6-month engagement.
The results
Conversion rose from 6.8% to 10.0% and revenue grew 73%, on an unchanged recipe, price and pack.
The ranking keyword count carrying a nutrition modifier went from sixty to seven hundred and forty, which is the second half of the mechanism: the brand was not only failing the comparison, it was absent from the searches where that comparison starts. ACoS fell nine points without a single bid change, because the clicks the account was already paying for now land on a page that wins the comparison they were bought for.
“The number that sells this product was printed on our packet the whole time. It was just divided by the wrong thing.”
Services we delivered
Related case studies


Ready to scale your Amazon brand?
Talk to a senior strategist and leave with a growth plan for your store — no obligation.