
The small grey line under the price was wrong on 174 listings
Conversion +71%
Amazon shows a price per unit beside the price. The brand's listings declared the wrong unit, so a 60-pack of pens looked more expensive than a competitor's 24-pack to anyone who read the small grey line.

At a glance
- Category
- Office Supplies
- Marketplaces
- US
- Revenue at start
- $148k / month
- Catalog
- 212 ASINs, mostly multipacks
- Problem
- Per-unit price wrong or missing on 174 listings
- Engagement
- Listing SEO + account management
- Timeframe
- 7 months
Results
The challenge
Office supplies are bought by comparison, and the comparison is not the one on the price tag. Amazon renders a small per-unit line — cents per sheet, per pen, per label — directly under the price, and in a category where the products are close to interchangeable, that line is the argument.
The brand's catalog had been uploaded over six years by four different people. Item counts were blank on most listings, unit-of-measure fields were inconsistent, and a number of multipacks declared themselves as a single item. The result was that a sixty-pen pack priced at $23 displayed as $23 per unit next to a competitor's twenty-four-pack showing 48 cents each. The brand was genuinely the cheaper product on almost every line and was losing the comparison on the only number shoppers used to make it.
Our approach
Unglamorous data work, then the copy around it.
- Full attribute audit of all 212 ASINs: item count, unit count, unit of measure and package quantity checked against the physical product.
- One correct convention written down and applied, so pens are priced per pen and paper per sheet across the whole catalog rather than per whichever field was filled first.
- Counts moved into titles and first bullets as well, since a shopper who does not read the grey line still reads the title.
- Campaign spend rebalanced toward the packs that win the comparison once the numbers rendered correctly — three sizes that had looked expensive turned out to be the catalog's strongest.
Timeline
Audit
- All 212 ASINs measured against their live attribute data
- 174 listings found wrong, blank or inconsistent
- A single unit convention agreed per product family
Correct
- Flat-file corrections submitted in family batches
- Counts added to titles and lead bullets
- Per-unit rendering verified listing by listing on mobile
Exploit
- Spend moved onto the packs with the best per-unit standing
- Two pack sizes retired for being genuinely uncompetitive
- Conversion tracked per family to confirm the lift held
Inside the ad account
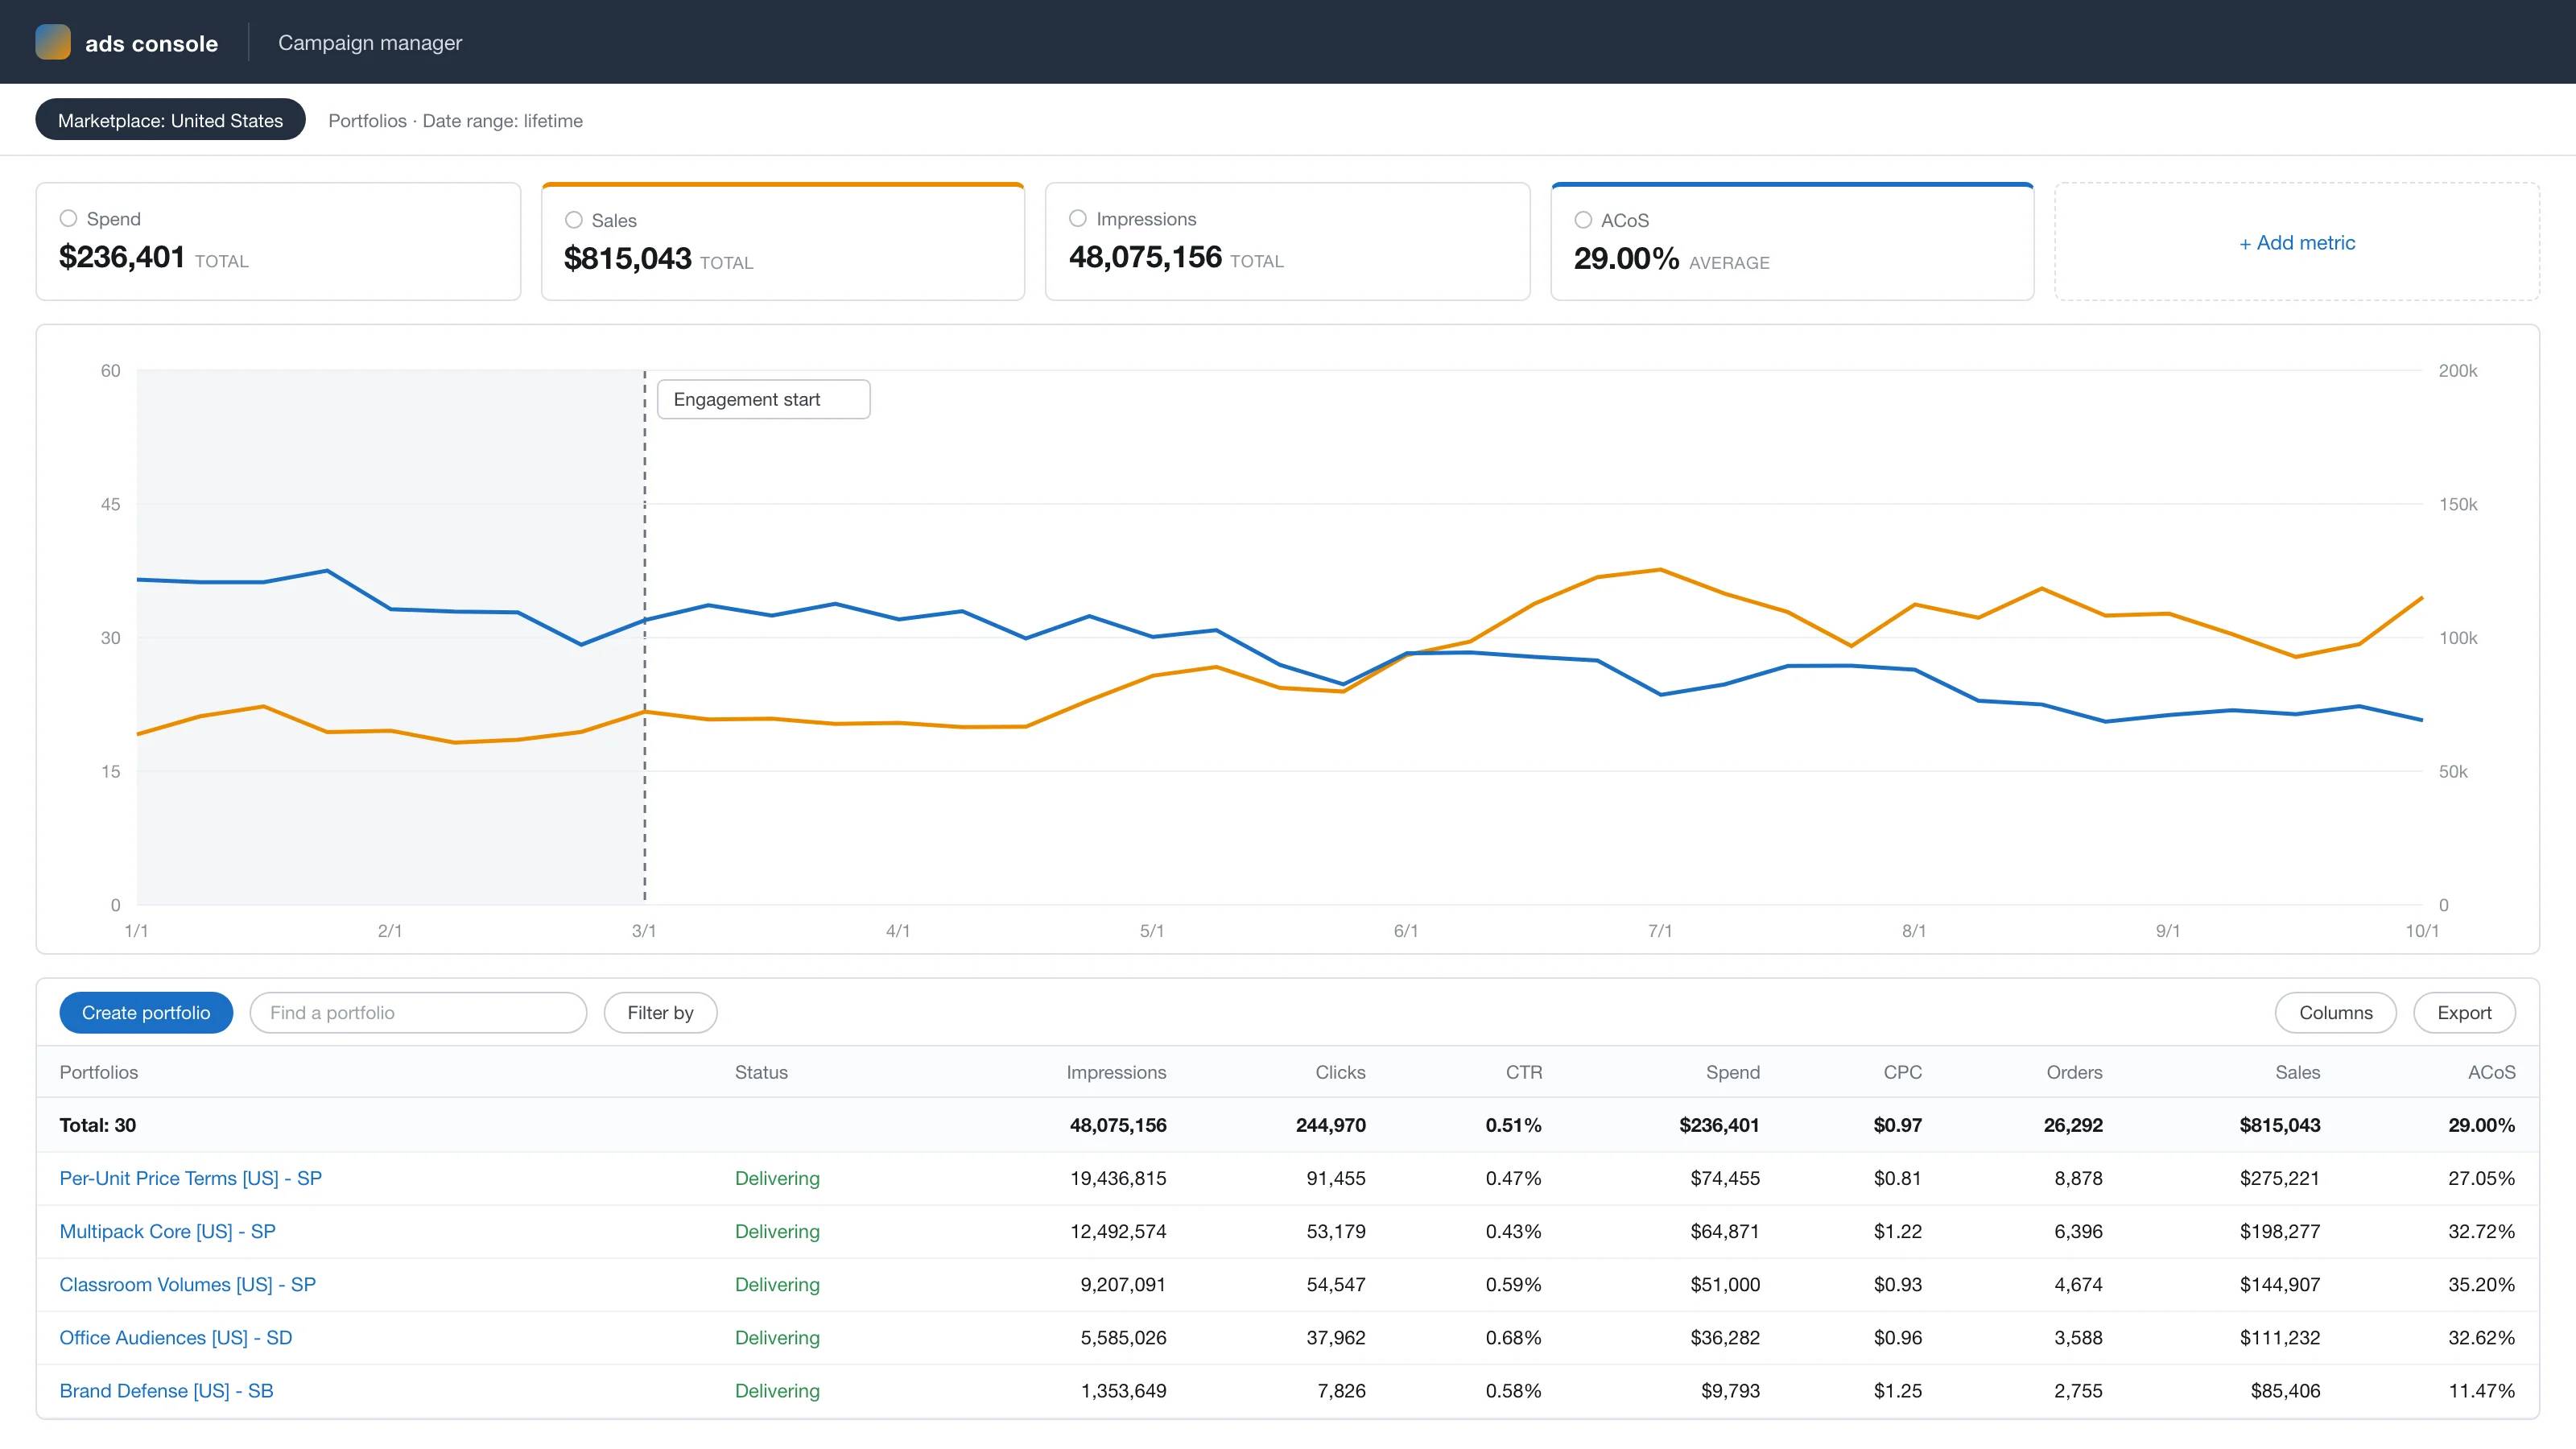
Anonymized account view, rebuilt from the figures reported above: ad sales growing from $67k to $120k a month while ACoS falls from 33% to 20% across the 7-month engagement.
The results
Conversion rose from 6.4% to 10.9% and revenue grew 80%, with no price change anywhere in the catalog.
ACoS fell thirteen points as a direct consequence — the same paid clicks now land on a page that wins its comparison instead of losing it. The most useful side effect was strategic rather than technical: once the per-unit numbers were true, the brand could see which of its pack sizes were actually competitive, and retired two that never had been.
“Four people built this catalog over six years, and not one of us ever checked what Amazon was printing underneath our price.”
Services we delivered
Related case studies




Ready to scale your Amazon brand?
Talk to a senior strategist and leave with a growth plan for your store — no obligation.