
Cutting fit returns by putting the tape measure on the page
Return rate 22% → 12%
More than one in five units came back, and most of them because the appliance did not fit the space it was bought for. The listings stated the dimensions of the product and none of the dimensions the shopper actually has to check.
At a glance
- Category
- Appliances
- Marketplaces
- US
- Revenue at start
- $410k / month
- Problem
- 22% return rate, most of it “didn't fit”
- Engagement
- Creative & content + listing SEO
- Timeframe
- 8 months
Results
The challenge
A returned appliance is the most expensive return there is. It travels back as freight, it is almost never resellable as new, and it usually arrives with a one-star review attached. This brand was absorbing that outcome on 22% of its orders, and the return reasons were overwhelmingly about space rather than performance.
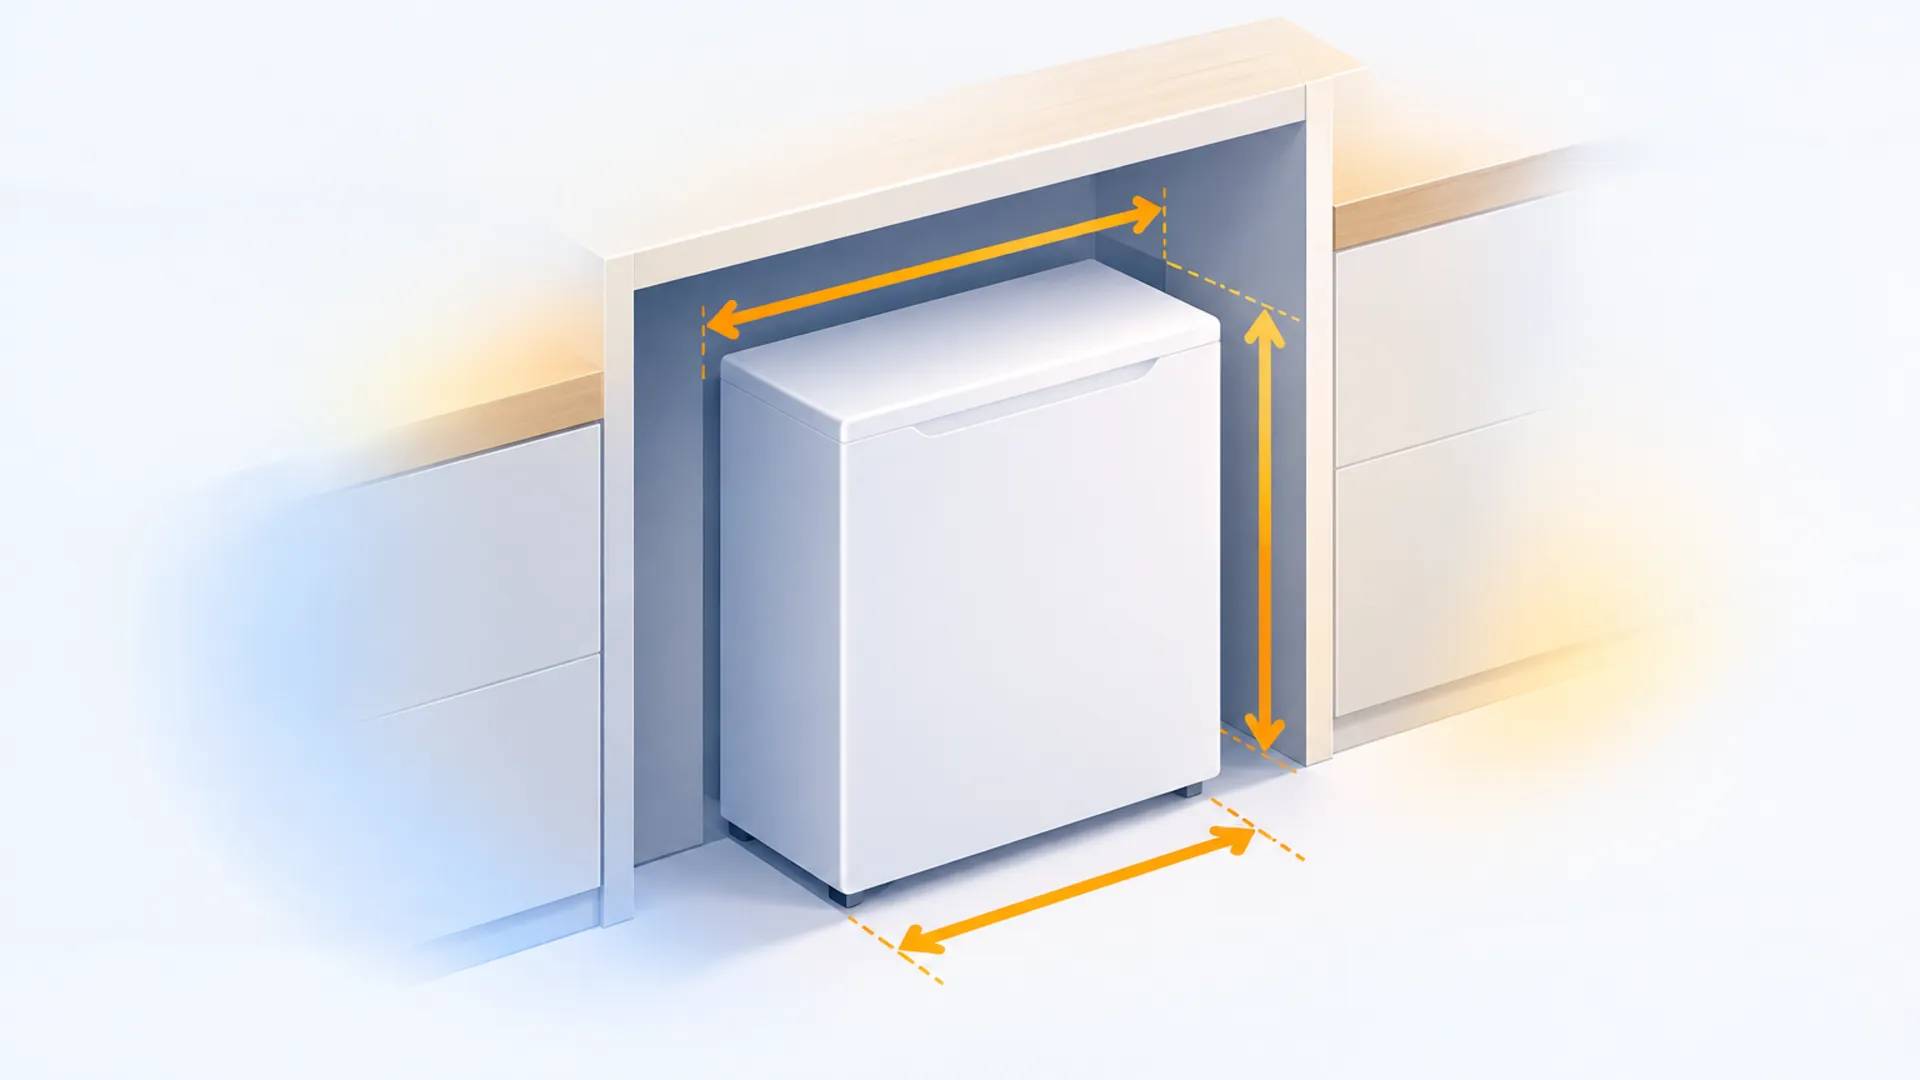
The listings carried a dimension line — width, height, depth — which is exactly the information a shopper cannot act on. Nobody was told that the depth figure excluded the door at ninety degrees, that the hinge side needed clearance to swing, or that the unit required an air gap behind it. Shoppers measured the alcove, compared three numbers, ordered, and discovered the rest on delivery day.
Our approach
We put the measurement the shopper has to take into the buying flow, before the order rather than after it.
- A clearance diagram as image two — total footprint with the door open, hinge swing arc, rear air gap and the minimum opening the unit needs.
- A three-measurement checklist written as instructions rather than specifications — what to measure, in what order, what to compare it to — with the opening width also filled into the structured attribute the left-hand filters read, since half the range had that field empty.
- Doorway and stairwell transit dimensions stated, because the second failure mode was a unit that fit the kitchen and not the hallway.
How we worked
- 1
Coding the returns
Fourteen months of return comments read and categorized: 71% were space-related, and two thirds of those were door swing or rear clearance rather than the cabinet opening itself.
- 2
Measuring the products properly
Every SKU re-measured with the door open and with packaging, producing a clearance figure the spec sheet had never contained.
- 3
Rebuilding image two
The second frame of every listing replaced with a dimensioned diagram, on the assumption that a shopper who swipes once is the one still deciding.
- 4
Writing the checklist
A three-step measuring guide added to A+ and repeated in the packaging insert for the next production run.
- 5
Watching by SKU
Return reasons tracked per ASIN for twelve weeks; two models still returning above 10% turned out to share a deeper handle and got their own diagram.
Inside the ad account
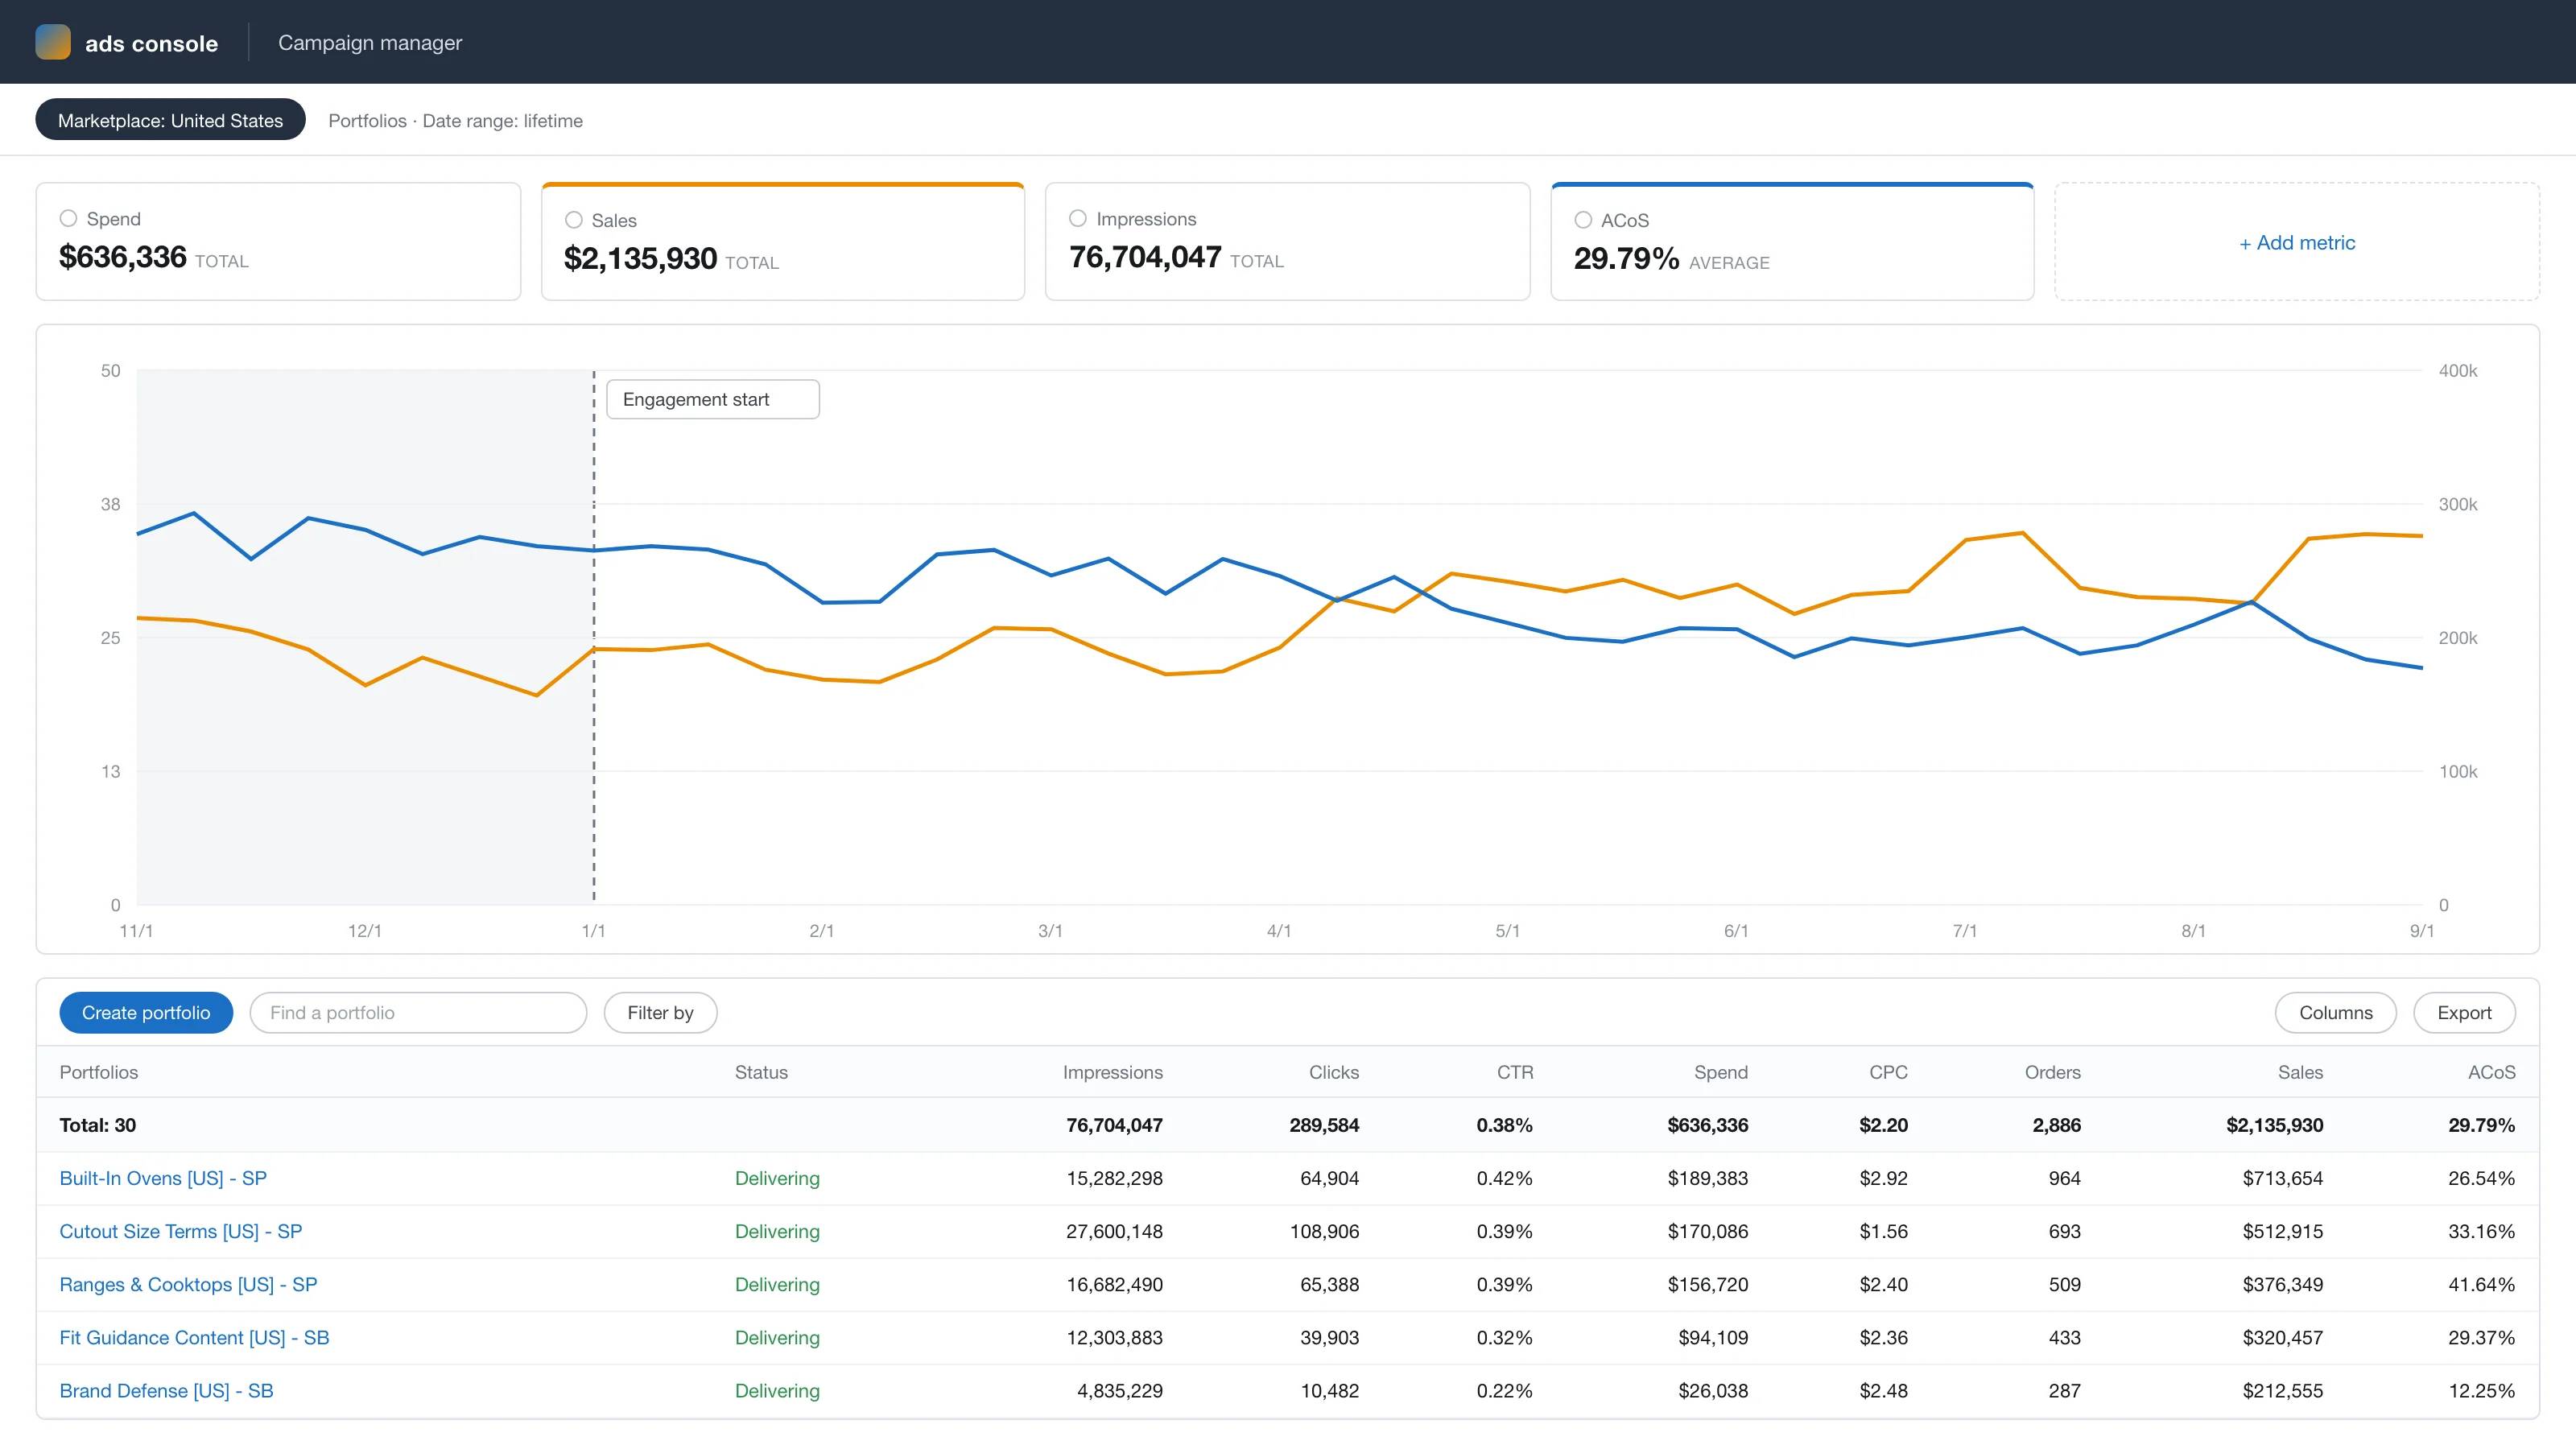
Anonymized account view, rebuilt from the figures reported above: ad sales growing from $185k to $269k a month while ACoS falls from 34% to 25% across the 8-month engagement.
The results
The return rate fell from 22% of orders to 12%, and the cost of handling returns fell with it — $61k a month to $34k.
Revenue grew 46% at the same time, which was not the point of the project but follows from it: the rating recovered from 3.8 to 4.2 once the reviews stopped being written by people whose appliance was sitting in a hallway. Not one product specification was touched. The listings simply started answering the question that decides the purchase.
“We published the size of the appliance. The customer needed the size of the hole it goes into. Those are not the same number.”
Services we delivered
Related case studies



Ready to scale your Amazon brand?
Talk to a senior strategist and leave with a growth plan for your store — no obligation.