
Spending when the shelf runs out, not when the month begins
ACoS 39% → 26%
An industrial consumables brand ran its advertising at a flat daily budget while its customers reordered in predictable waves. Matching the spend curve to the consumption curve cut wasted clicks by more than half.

At a glance
- Category
- Industrial & Scientific
- Marketplaces
- US, CA
- Revenue at start
- $412k / month
- Buying pattern
- Repeat orders every 5–9 weeks per account
- Engagement
- PPC + full account management
- Timeframe
- 11 months
Results
The challenge
Industrial consumables are not bought when an advertisement is seen. They are bought when the stockroom runs low, which for this brand's customers happened on a rhythm of five to nine weeks depending on the plant. Demand therefore arrived in waves that repeated per account and, aggregated across thousands of accounts, produced a visible weekly and monthly shape.
The advertising ignored all of it. A flat daily budget spread the same money across every day of the month, which meant paying full price for clicks on days when nobody in the customer base needed anything, then capping out on the days when they all did. The account looked stable and was quietly buying its worst traffic at the same rate as its best.
Our approach
We treated the reorder interval as the planning unit instead of the calendar month.
- Consumption curve reconstructed from three years of order dates, per SKU and per order size, to find where the waves actually fall.
- Budgets shaped to the curve — daily caps raised sharply inside reorder windows and pulled back between them, rather than averaged flat.
- Scheduled budget rules by day of week, since procurement concentrates Monday to Thursday — search advertising has no hour-of-day bid control, so the pacing is done with the budget lever that does exist.
- Separate campaigns for first-time and returning demand, so the expensive discovery traffic is not paced against the cheap replenishment traffic.
How we worked
- 1
Rebuilding the demand shape
Three years of order history mapped by SKU and week to identify the intervals that repeat and the ones that were noise.
- 2
Two months of unchanged spend
Budgets left alone while the model was validated against live data, so the comparison would be honest.
- 3
Wave pacing
Daily caps tied to the forecast curve — up to 3x baseline inside a wave, down to 0.4x between them.
- 4
Splitting discovery from replenishment
Branded and repeat-buyer traffic separated into their own campaigns with their own targets.
- 5
Monthly recalibration
The curve refreshed each month; two SKUs turned out to have shifted cycles after a packaging change.
Inside the ad account
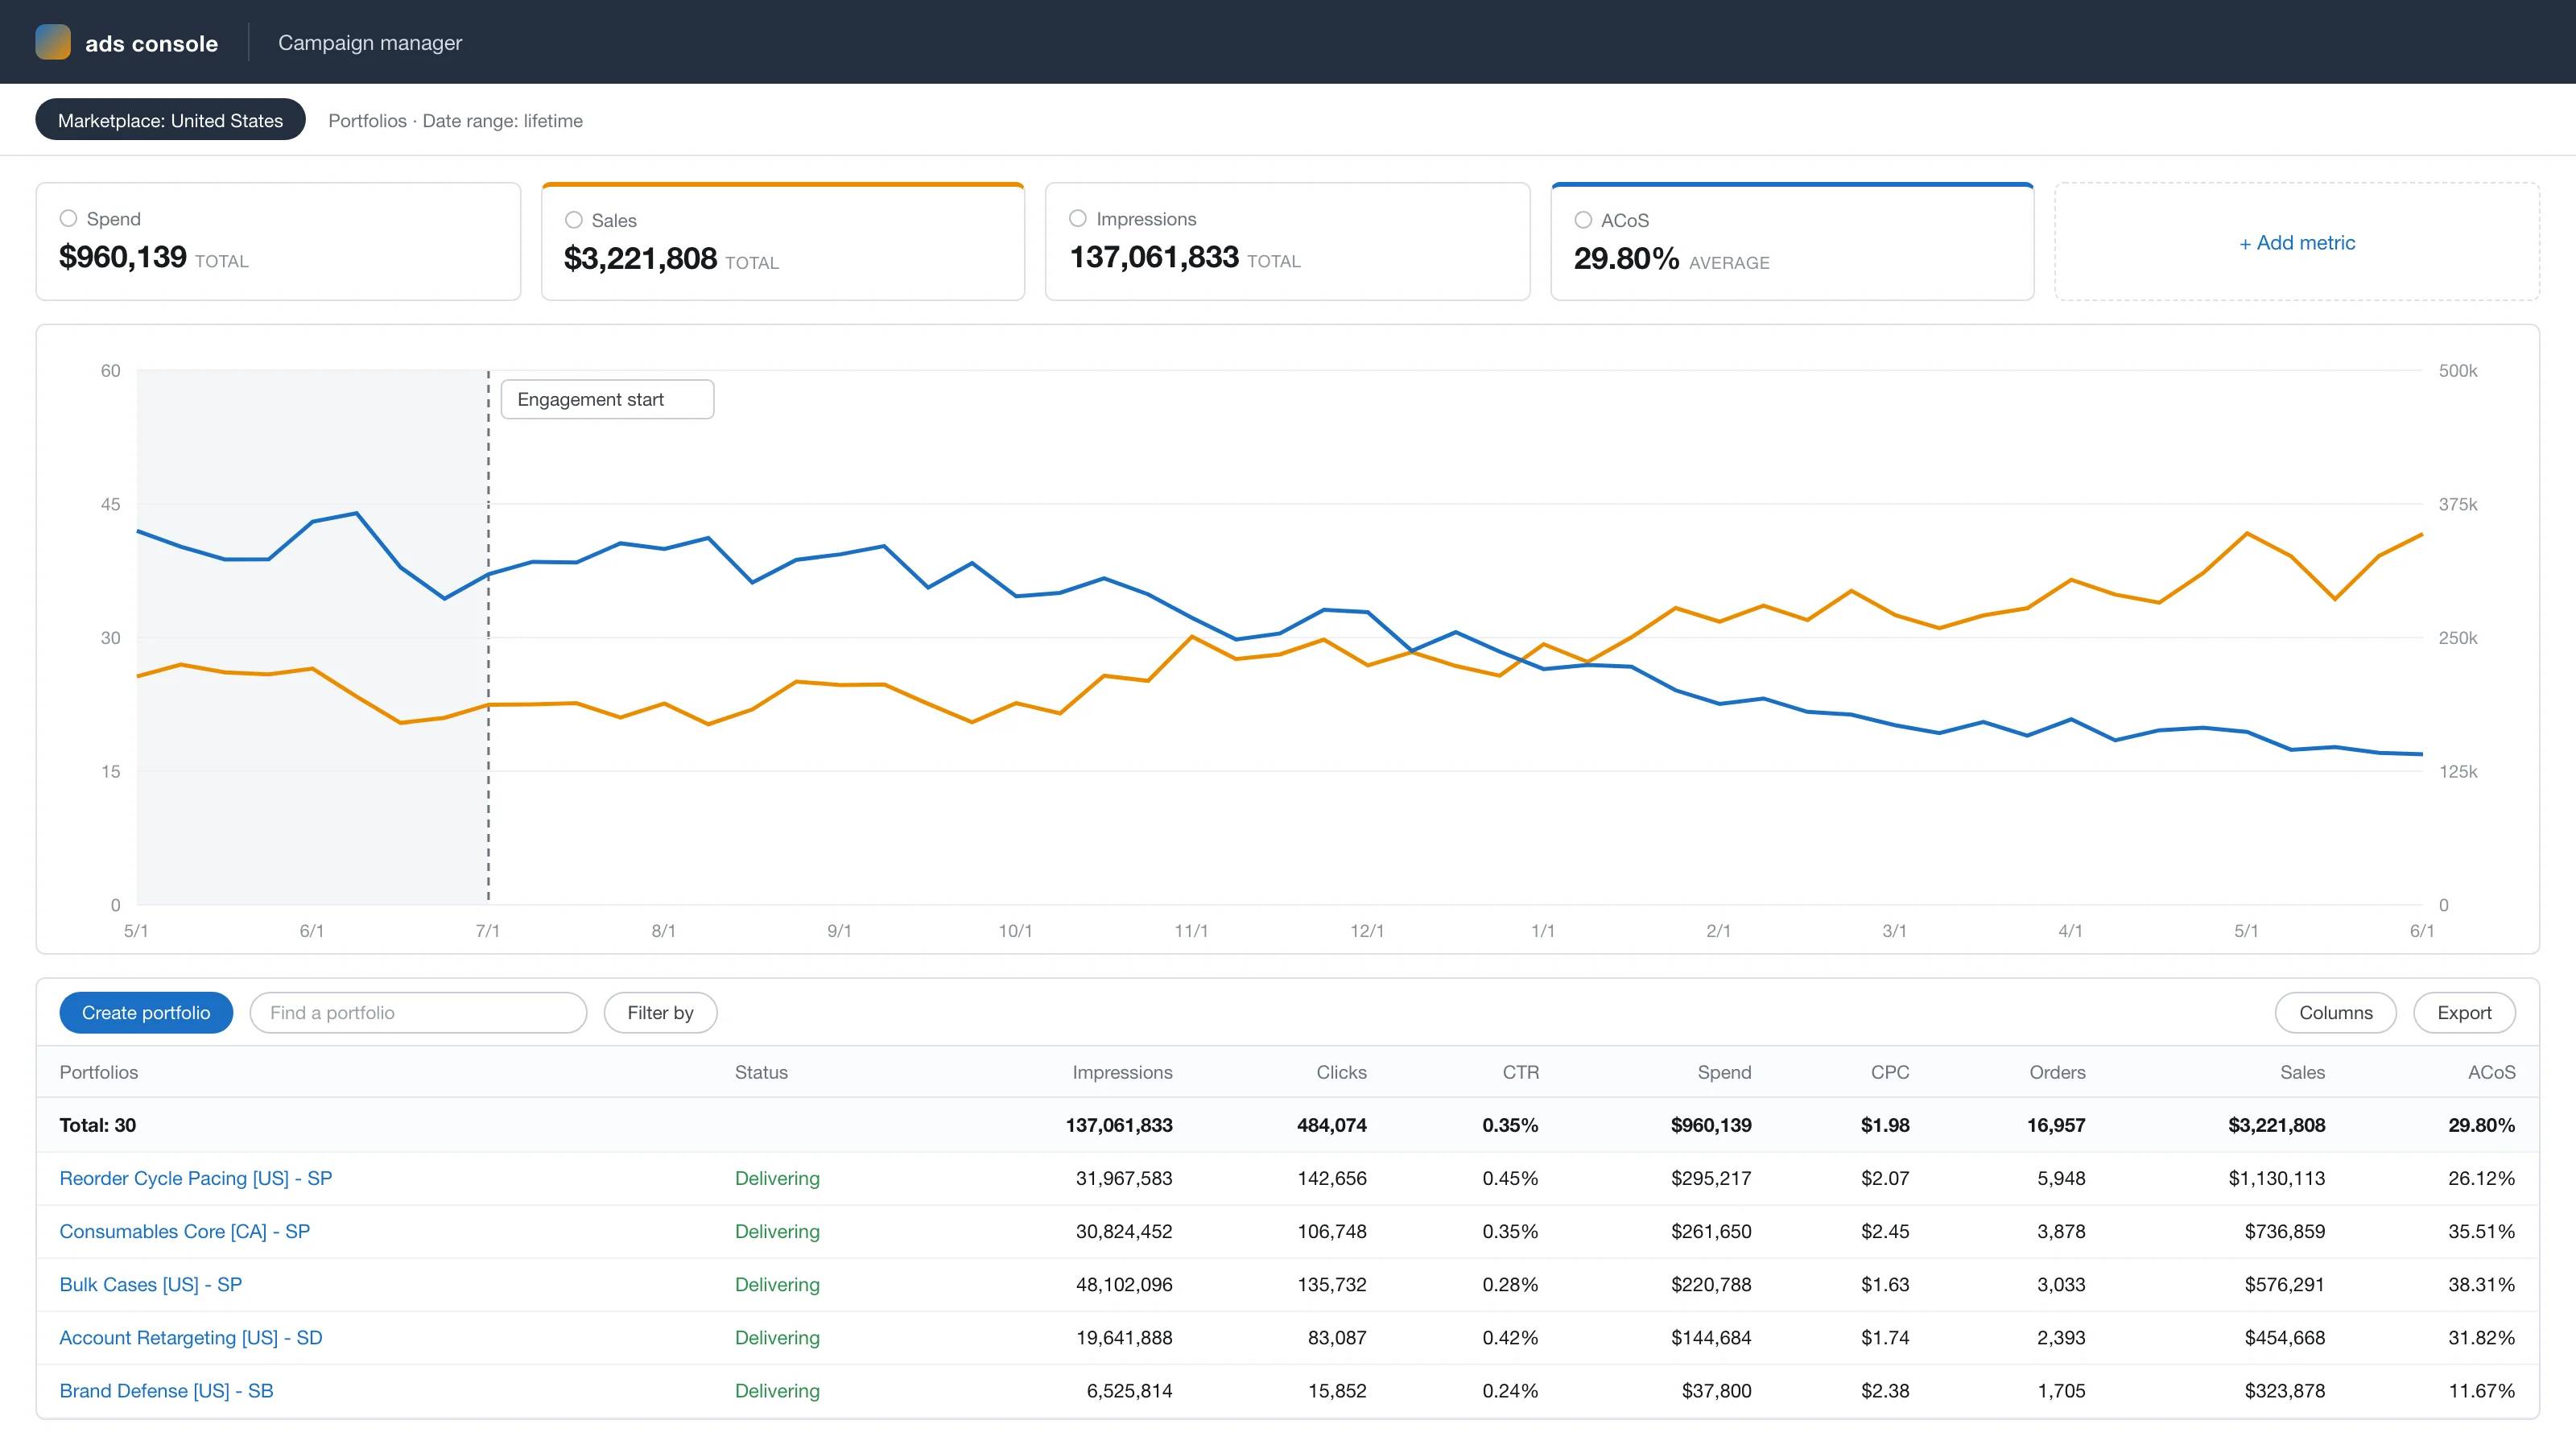
Anonymized account view, rebuilt from the figures reported above: ad sales growing from $185k to $310k a month while ACoS falls from 39% to 18% across the 11-month engagement.
The results
ACoS fell from 39% to 26% while revenue grew 67%, because the same budget now lands on the days when a purchase is actually imminent.
Wasted spend on zero-conversion days dropped by roughly $22k a month, and repeat-order share rose twenty-seven points — the pacing keeps the brand visible precisely when an existing customer is deciding whether to reorder or to try whatever is cheapest that week. Nothing about the listings, the products or the prices changed.$
“Our customers buy on their schedule, not ours. We had been advertising on ours for six years.”
Services we delivered
Related case studies




Ready to scale your Amazon brand?
Talk to a senior strategist and leave with a growth plan for your store — no obligation.