
TACoS on Amazon: Why Total Ad Cost of Sales Beats ACoS as a Growth Metric
ACoS grades your campaigns. TACoS grades the business behind them: total ad spend against total revenue, including the organic sales your ads helped create.


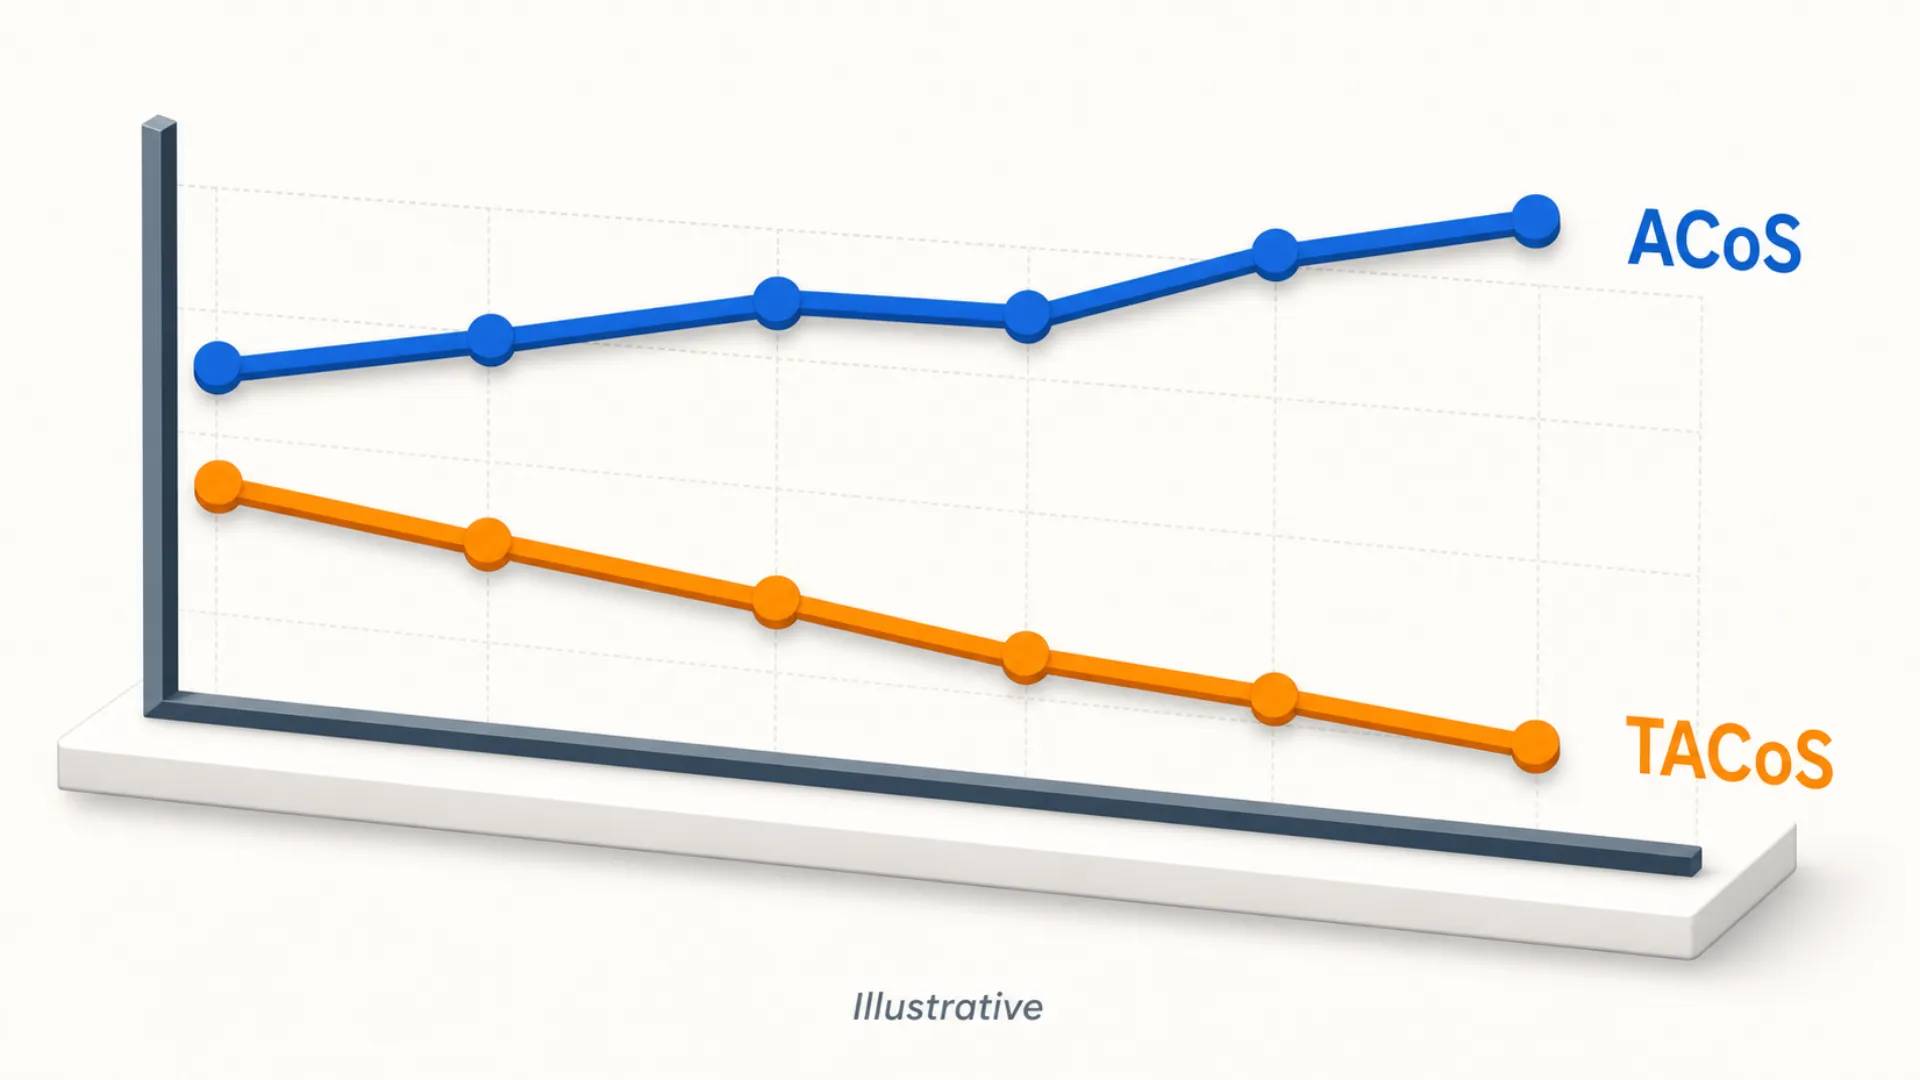
TACoS on Amazon (Total Advertising Cost of Sales) is total ad spend divided by total revenue, organic and ad-attributed combined, and it is the closest thing the marketplace gives you to a growth metric. ACoS grades a campaign; TACoS grades the business the campaigns are supposed to be building. When ad spend rises and TACoS falls, advertising is buying organic momentum. When ad spend rises and TACoS rises with it, you are renting sales.
What TACoS Means on Amazon
The formula is deliberately simple. The interesting part is which denominator you use.
| Metric | Formula | Question it answers |
|---|---|---|
| ACoS | Ad spend ÷ ad-attributed sales | How efficient is this campaign? |
| TACoS | Ad spend ÷ total sales (organic + ad-attributed) | What share of the whole business is advertising costing? |
| Organic share | (Total sales − ad sales) ÷ total sales | How much of the revenue is not paid for? |
A worked example. You spent $25,000 on Amazon Ads last month. The Ads console attributed $75,000 in sales to those campaigns. Your Seller Central sales for the same period were $200,000. ACoS is $25,000 ÷ $75,000 = 33%. TACoS is $25,000 ÷ $200,000 = 12.5%. Same spend, two very different readings: a third of ad revenue went to Amazon, but only an eighth of the business did.
That gap is the whole point. The $125,000 that arrived without an ad click is what ACoS cannot see, and it is usually the part of the business that decides whether the brand is worth owning.
TACoS is not a native metric, and that is why most brands ignore it
Amazon does not display TACoS anywhere in Seller Central or the Ads console. You assemble it from two systems: total ad spend from the advertising console (all campaign types, not just Sponsored Products), and total ordered product sales from Reports → Business Reports in Seller Central, either the Sales Dashboard or the Detail Page Sales and Traffic report. Most third-party analytics tools calculate it for you by joining the same two sources.
The most common reporting error is pulling Sponsored Products spend only and forgetting Sponsored Brands and Sponsored Display. That understates the numerator and produces a flattering TACoS that has nothing to do with reality. Whatever you do, be consistent: same campaign types, same date range on both sides, same attribution window month over month.
Note the naming trap while you are here. TACoS is Total Advertising Cost of Sales. It is not "target ACoS", which is a completely different thing (the efficiency ceiling you set for a campaign), and the two get mixed up constantly in agency reporting.
Why ACoS Alone Sends You in the Wrong Direction
ACoS is a good metric for the job it was designed for: judging whether a keyword, an ad group or a campaign pays for itself inside its attribution window. We use it every day. The problem starts when it becomes the only number on the dashboard, because ACoS can always be improved by doing less.
Cut bids, pause every mid-performing keyword, keep only branded and long-tail exact match, and ACoS drops within a week. So does impression share, so does new-customer acquisition, and a few weeks later so does organic rank, because the sales velocity that was holding the position stopped arriving. The ACoS chart looks like a win the entire time. Revenue quietly shrinks. If you want the mechanics of the metric itself, we covered them in what ACoS is and what a good ACoS really means.
TACoS closes that loophole. You cannot improve TACoS by shrinking the account, because the denominator is the whole business. The only way TACoS falls sustainably is if total revenue grows faster than ad spend, and on Amazon that means organic sales are picking up the difference.
How TACoS Exposes the Paid/Organic Relationship
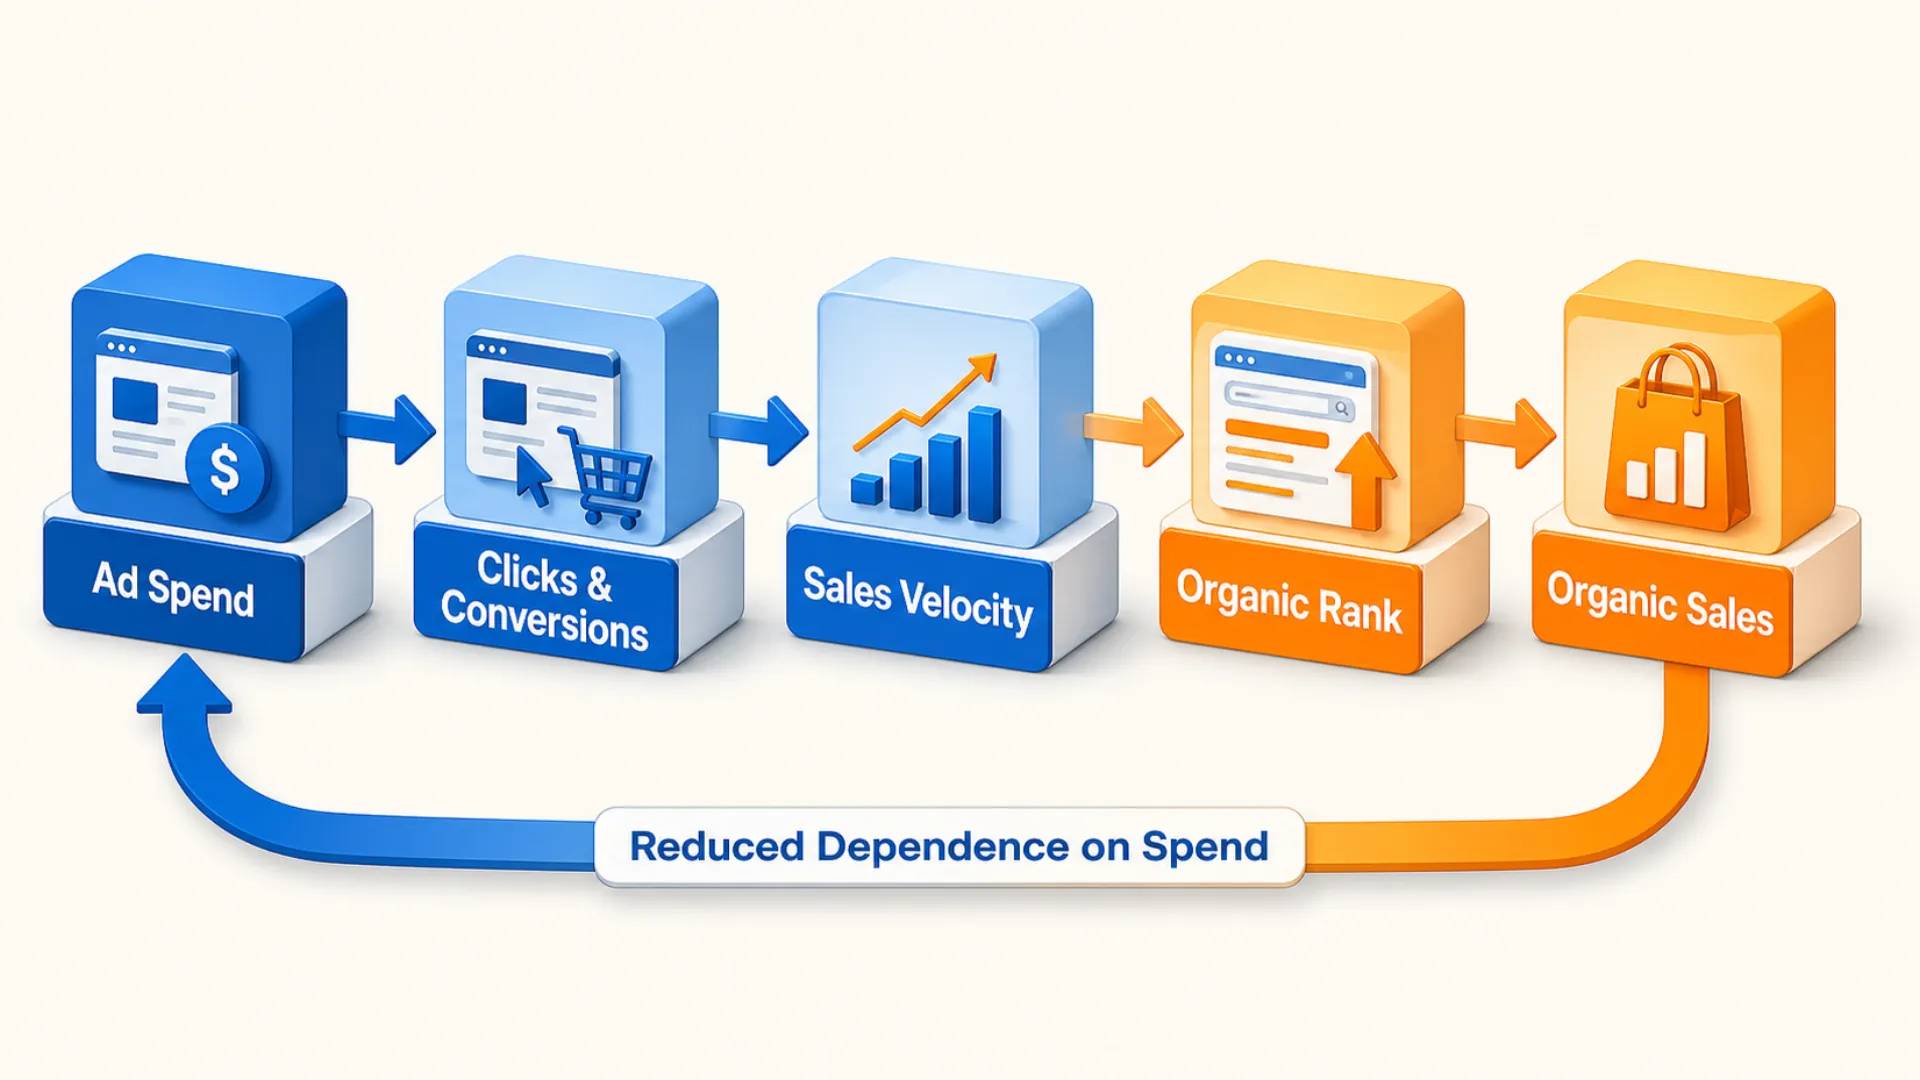
Advertising does not buy organic rank on Amazon directly. What it buys is the behavior Amazon's ranking system reads: clicks on a query, conversions on that query, and sustained sales velocity for the ASIN. Those signals are the same ones that decide organic placement, which is why a well-targeted campaign on a listing that already converts tends to pull organic rank up behind it. We go through that chain in detail in how Amazon ranking actually works.
TACoS is the readout on that process. Three patterns, and each one means something specific:
- Ad spend up, TACoS down. The healthy pattern. Every incremental dollar of spend is producing more than a dollar of incremental total revenue, and the organic base is thickening underneath. This is what a working launch-to-scale curve looks like.
- Ad spend up, TACoS flat. Advertising is buying revenue at a constant price. Not a crisis, and often exactly right in a competitive category, but it means you are scaling by buying, not by compounding. Check whether organic share is at least holding.
- Ad spend up, TACoS up. You are paying more to stand still. Either the listing has stopped converting, competitors have raised the clearing price of your keywords, or the campaigns have drifted onto terms that never convert organically. This is the pattern that shows up right before a brand plateaus.
There is a fourth, less obvious pattern: spend flat, TACoS falling, revenue rising. That is the strongest signal in the set. Something other than ads (a listing rewrite, better images, a review inflection, a seasonal tailwind) is generating sales, and the ad budget is now a smaller share of a bigger business. When it happens after a listing project, it is measurable proof the project worked. That is what the pet supplements brand we worked with saw when organic sales rose 187% off listing and Rufus optimization — ad spend was not the variable that moved.
A Six-Month Scenario: Watching the Two Metrics Diverge
The table below is an illustrative example, not client data. It is built to show a single mechanic: a brand scaling spend deliberately, letting ACoS drift upward as it pushes into broader, less efficient keywords, while TACoS falls because the organic base grows faster than the budget.
| Month | Ad spend | Ad sales | Total sales | ACoS | TACoS | Organic share |
|---|---|---|---|---|---|---|
| 1 | $20,000 | $62,500 | $100,000 | 32% | 20.0% | 38% |
| 2 | $22,000 | $68,750 | $118,000 | 32% | 18.6% | 42% |
| 3 | $24,000 | $72,700 | $140,000 | 33% | 17.1% | 48% |
| 4 | $26,000 | $76,500 | $168,000 | 34% | 15.5% | 54% |
| 5 | $28,000 | $80,000 | $200,000 | 35% | 14.0% | 60% |
| 6 | $30,000 | $83,300 | $240,000 | 36% | 12.5% | 65% |
Read it through an ACoS-only lens and month 6 looks like a failure: efficiency decayed four points while spend went up 50%. Every instinct says pull bids back.
Read the same six months through TACoS and it is one of the better outcomes on the marketplace. Revenue is up 140%, ad spend is up 50%, and the organic share of the business went from 38% to 65%. The extra spend was not lost; it was the price of the ranking that now delivers two thirds of the revenue for free. Pull the bids in month 4 and you would have cut the process off halfway, protecting a number that was never the objective.
The inverse case is just as instructive and much more common. An outdoor brand we took over had ACoS at 44% and brought it to 21% while growing 68% — efficiency and volume moving together. That only counts as a win because revenue grew alongside it. Had revenue been flat, the same ACoS improvement would have been a slow retreat with a nice-looking chart.
What Is a Good TACoS on Amazon?
There is no single answer, and anyone quoting one number is selling something. Commonly cited industry ranges from Amazon tooling vendors and agencies cluster around 5–15% overall, with the target moving by lifecycle stage:
| Stage | Typical published TACoS range | What it means |
|---|---|---|
| Launch / new ASIN | ~15–25% | Ads are buying the first sales velocity; almost all revenue is paid |
| Scaling | ~10–15% | Organic is forming; spend is still doing most of the recruiting |
| Mature / established | ~5–10% | Organic carries the majority of sales; ads defend rank and recruit new buyers |
| Sustained above ~20% | — | Either an intentional launch push, a brutally competitive category, or structural campaign problems |
Treat those as orientation, not targets. Two constraints matter more than any published benchmark.
First, your margin. TACoS is a cost line for the whole business, so it has to fit inside contribution margin after COGS, referral fees and fulfillment. A 12% TACoS is comfortable on a 45% contribution margin and lethal on a 15% one. If you have not built that number recently, start from the true profit per unit after FBA fees and work up — most "our TACoS is too high" conversations are really margin conversations.
Second, your intent this quarter. A brand deliberately taking share in a new subcategory should run a higher TACoS than a brand harvesting a mature catalog. Both can be correct at the same time inside one account, which is why a single account-level TACoS target usually falls apart on contact with the catalog.
Why the number belongs at ASIN and product-line level
Account-level TACoS is an average of things that have nothing to do with each other: a hero ASIN in year four, a launch in month two, and a long tail nobody advertises. The average tells you very little, and it moves for reasons that are pure mix.
Calculate TACoS per ASIN or per product line and it becomes decision-grade. The hero product should be trending toward its mature band. The launch should be running high on purpose, with a date by which you expect it to come down. Anything with a rising TACoS and flat units is a diagnostic case, not a budget case. That segmentation is also the first thing we build when we take over Amazon PPC management for a brand, because it is the only way to tell a legitimate investment from a leak.

When TACoS Misleads
TACoS is a better strategic metric than ACoS, not an infallible one. It has failure modes, and they cluster in a few places.
Anything that changes revenue without changing advertising. A price increase, a Lightning Deal, a subscription program, wholesale or B2B orders landing in the same account: all of them move the denominator and shift TACoS with no change in advertising quality whatsoever. Deal-heavy months look like advertising triumphs. They usually are not.
Stockouts, in both directions. Going out of stock shrinks revenue and inflates TACoS, and coming back in stock does the reverse. Neither has anything to do with campaign performance, and both take weeks to unwind because rank recovery lags availability.
Seasonality and mix. A brand with a Q4-weighted catalog will see TACoS drop every December on volume alone. Compare like periods, or year over year, before you conclude anything.
Attribution windows. Ad-attributed sales land inside a window (Sponsored Products uses a 7-day click window for seller accounts and 14 days for vendor accounts; Sponsored Brands and Sponsored Display use 14-day click windows), while total sales are booked on the order date. In a fast-scaling month the two are misaligned at the edges. It matters less for TACoS than for ACoS, since the denominator is not attribution-based, but it makes month boundaries noisy. Note too that Amazon revised how view-through conversions are attributed at the start of 2026, which changes reported ad sales for display formats without changing anything about the underlying business — one more reason to compare periods on the same measurement basis.
Very small numbers. On a $20k/month ASIN, one bulk order swings TACoS by points. The metric needs volume and a few months of history before the trend line means anything.
Lag. Ads bought today produce ranking effects over weeks, not days. A month where you increased spend will show a worse TACoS before it shows a better one. If you judge the decision on 30 days you will reverse it exactly when it starts to work.
The practical guard against all of this is to read TACoS as a trend across at least three months, at ASIN level, alongside two other lines: total revenue and organic share. TACoS alone can be moved by accident. TACoS falling while revenue rises and organic share climbs cannot.
Which Metric Belongs on Which Report
Neither metric replaces the other; they operate on different clocks.
- Daily and weekly (ACoS, at campaign and keyword level). Bids, negatives, budget caps, placement adjustments, obvious waste. This is a management loop.
- Monthly and quarterly (TACoS, at ASIN and product-line level). Budget allocation between products, launch investment decisions, whether the last quarter's listing work paid off. This is a strategy loop.
- Always alongside both: total revenue and organic share. They are the sanity check that stops either ratio from being gamed.
If you want the side-by-side including ROAS and where each ratio breaks down, we laid it out in ACoS vs ROAS vs TACoS.
FAQ
What is a good TACoS on Amazon?
Commonly published ranges put a healthy TACoS at roughly 5–15%, with mature products near 5–10%, scaling products around 10–15%, and launches often 15–25%. The correct target is the one that fits inside your contribution margin after fees, and the trend matters more than the absolute figure.
Is a 10% TACoS good?
Usually yes, for an established product. A 10% TACoS means advertising costs a tenth of total revenue, which sits comfortably inside most healthy Amazon margins. It is less good if it has been climbing for three months, and it is expensive if your contribution margin after fees is under 20%.
What is the difference between ACoS and TACoS?
ACoS divides ad spend by ad-attributed sales and measures campaign efficiency. TACoS divides the same ad spend by total revenue, organic and paid combined, and measures what advertising costs the business overall. ACoS can be improved by spending less; TACoS improves only when total revenue grows faster than spend.
Does Seller Central show TACoS?
No. Amazon reports it in neither Seller Central nor the Ads console. You calculate it by taking total ad spend across all campaign types from the advertising console and dividing by total ordered product sales from Reports, then Business Reports, for the identical date range. Most analytics tools automate the join.
Why is my TACoS going up while sales are flat?
Rising TACoS with flat revenue means you are paying more to hold the same position. The usual causes are a drop in listing conversion rate, higher competitor bids raising the clearing price of your keywords, campaigns drifting onto low-intent terms, or organic rank slipping after a stockout. Diagnose conversion before adjusting bids.
Where to Start This Week
Pull three months of ad spend and three months of total sales, split by product line rather than by account, and plot TACoS next to total revenue and organic share. Most brands find one product line quietly funding the rest.
- Compute TACoS per ASIN or product line for the last three months, not just account-level.
- Sort by direction of travel, not by size: rising TACoS with flat units is the queue to work.
- Set a target band per lifecycle stage and write down the date you expect each launch to reach the scaling band.
If the split is hard to produce because campaigns and ASINs do not map cleanly onto each other, that itself is the finding, and it is worth fixing before the next budget decision. A structural read of the account is what our Amazon growth plan is built to produce.