What Is ACoS on Amazon? Formula, Benchmarks and What a Good ACoS Really Is
ACoS is only meaningful next to your margin. The formula, a break-even ACoS worked from real unit economics, category benchmarks, and the misreadings that cost money.


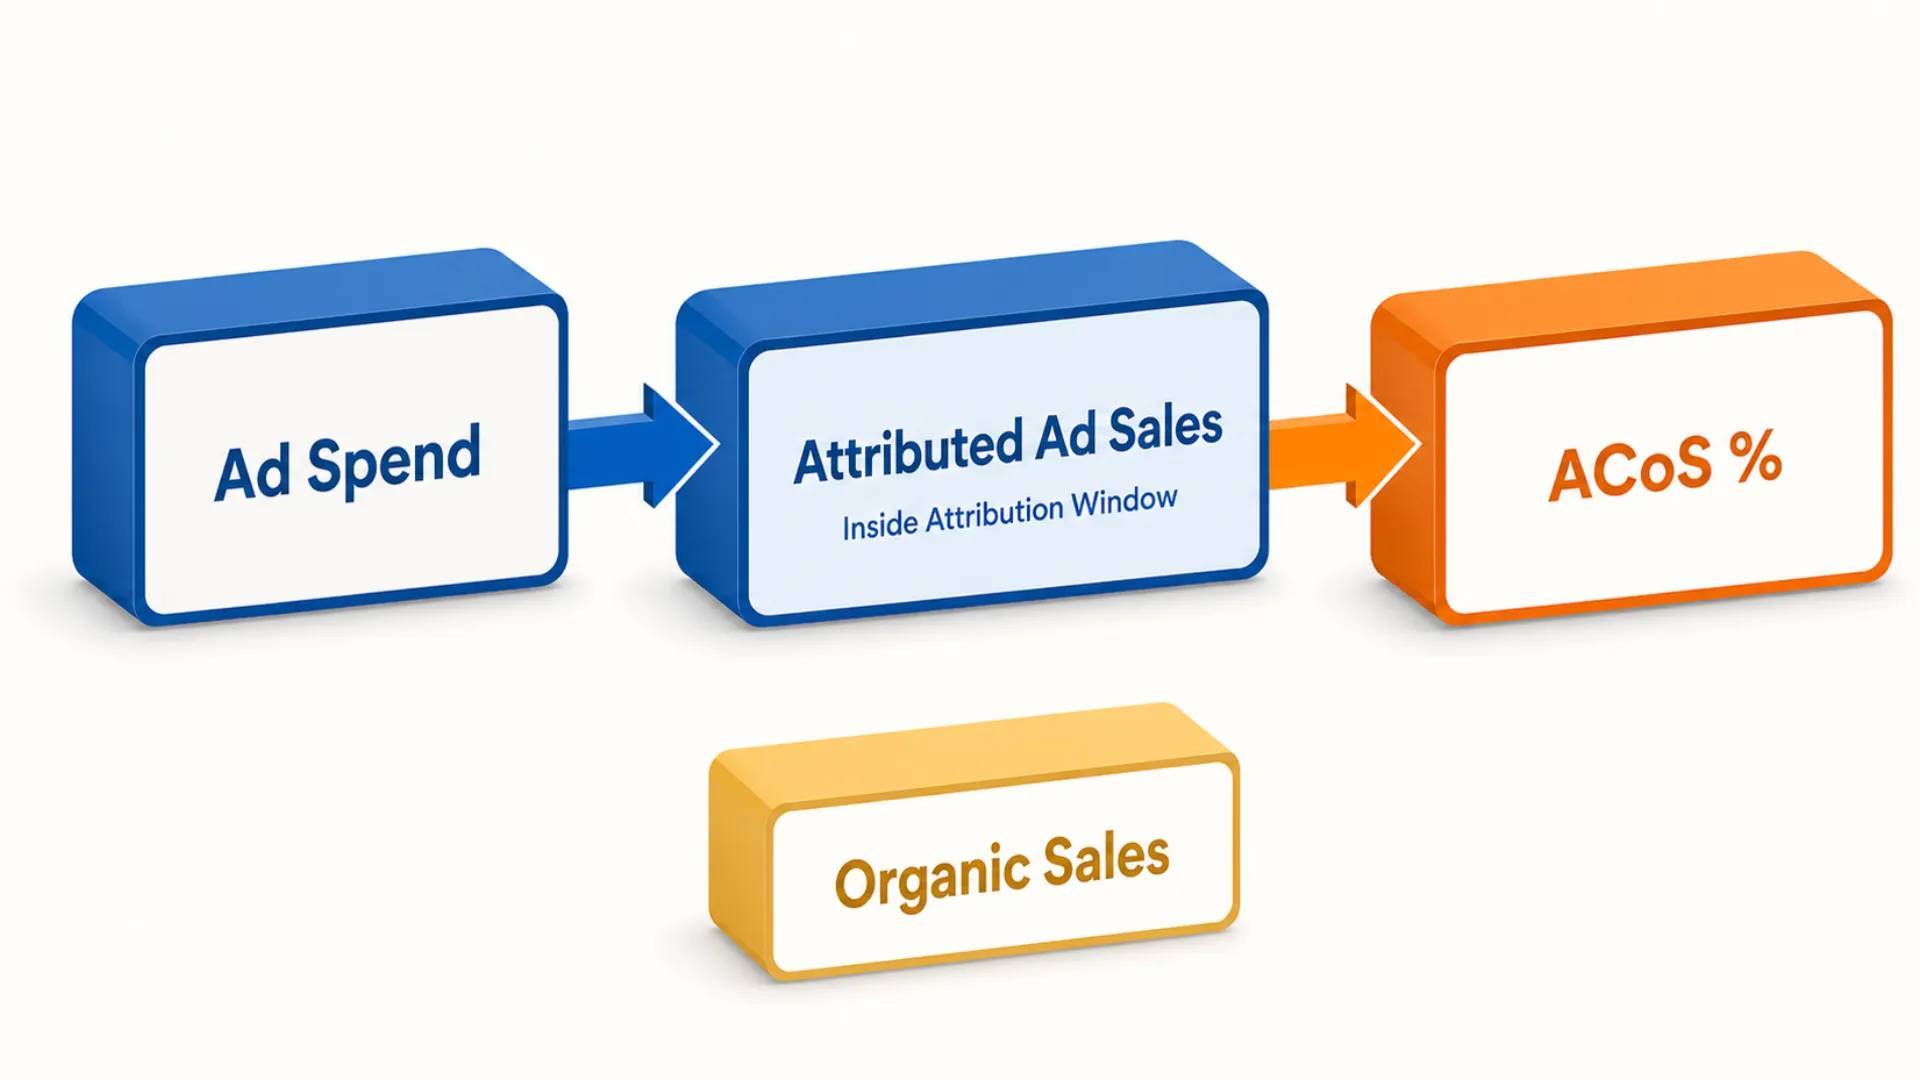
ACoS (advertising cost of sales) is the share of your ad-attributed revenue that you spent on ads: ad spend divided by ad sales, expressed as a percentage. Amazon Ads defines it exactly that way — spend $50 to generate $100 in attributed sales and your ACoS is 50%. The number itself is neutral. It only becomes a decision when you compare it to the margin the product actually earns, which is where most accounts get it wrong.
What ACoS means on Amazon
ACoS answers one narrow question: for every dollar of sales that Amazon credited to your ads, how many cents went to Amazon Ads?
The formula
The calculation has no variants and no hidden coefficients.
| Metric | Formula | Example |
|---|---|---|
| ACoS | (ad spend ÷ ad sales) × 100 | ($2,400 ÷ $8,000) × 100 = 30% |
| ROAS | ad sales ÷ ad spend | $8,000 ÷ $2,400 = 3.33x |
| Relationship | ACoS = 1 ÷ ROAS | 1 ÷ 3.33 = 30% |
ACoS and ROAS are the same fact stated in opposite directions. A 20% ACoS is a 5x ROAS, 25% is 4x, 33% is 3x. Teams that report both are not measuring two things — they are measuring one thing twice. Which of the two you should actually steer by, and where TACoS fits, is the subject of ACoS vs ROAS vs TACoS.
What counts as "ad sales"
This is where the definition gets slippery, and it is the reason two people can look at the same account and quote different ACoS figures.
- Ad sales are attributed sales, not incremental sales. If a shopper clicks your Sponsored Products ad and then buys within the attribution window, that order counts as ad sales — whether or not the ad changed the outcome. Some of those buyers would have found you organically.
- The attribution window differs by ad type. Third-party sellers get a 7-day click attribution window on Sponsored Products, and 14 days on Sponsored Brands and Sponsored Display. So a Sponsored Products campaign you judge on day three is showing you an incomplete numerator-denominator pair, and yesterday's ACoS will keep improving for a week as sales settle.
- Attribution scope differs too. Sponsored Products reports same-SKU sales for the advertised ASIN; Sponsored Brands and Sponsored Display include brand-halo sales — other products under your brand bought after the click. Comparing an SP ACoS to an SB ACoS is therefore not comparing like with like.
None of this makes ACoS a bad metric. It makes it a campaign efficiency metric with a defined scope, rather than a verdict on the business.
Break-even ACoS: the number that makes ACoS mean something
A 25% ACoS is excellent on a product with a 45% contribution margin and quietly loss-making on one with a 20% margin. Until you know your break-even ACoS, "good" and "bad" are opinions.
Break-even ACoS is your contribution margin expressed as a percentage of price. It is the ACoS at which an advertised sale contributes exactly zero — every point below it is profit, every point above it is subsidy. Amazon Ads makes the same point in its own guidance: there is no universal good ACoS, so brands should work from their margin and their break-even instead of a benchmark.
A worked example
Below is a single unit of a mid-priced supplement. The figures are illustrative inputs, not benchmarks — pull your own from the fee preview in Seller Central and your landed cost sheet.
| Line | Per unit | Note |
|---|---|---|
| Sale price | $34.99 | Price the shopper pays |
| Landed COGS | −$8.00 | Manufacturing + freight + duty, per unit |
| Amazon referral fee | −$5.25 | 15% — the standard rate for most categories |
| FBA fulfillment fee | −$6.20 | Size-tier and price-band dependent |
| Returns and damages allowance | −$1.05 | 3% of price, modeled |
| Contribution margin | $14.49 | What one sale contributes before ad spend |
| Break-even ACoS | 41.4% | $14.49 ÷ $34.99 |
So on this unit, an ACoS of 41.4% means the ad paid for itself and nothing more. At 30% you keep about $4 per advertised unit. At 55% you are buying revenue with your own money.
Two things skew this table in practice, and both are worth checking before you trust the output. First, referral fees are not a flat 15% everywhere: Amazon's published schedule runs from around 8% on consumer electronics up to 17% on higher-priced apparel and 20%+ on jewelry, with tiered rates in several categories and a per-item minimum of about $0.30. Second, fulfillment fees changed shape in 2026 — Amazon now publishes standard-size fulfillment rates in price bands (under $10, $10–$50, over $50), so two physically identical units at different prices no longer pay the same fee, and a 3.5% fuel and logistics surcharge sits on top of every FBA fulfillment fee from April 2026. We unpack the full stack in Amazon FBA fees explained.
From break-even to target ACoS
Break-even is a ceiling, not a goal. Target ACoS is the number you actually manage to, and it depends on what you want each advertised sale to leave behind.
| Scenario | Calculation | Target ACoS | Equivalent ROAS |
|---|---|---|---|
| Break even on the unit | $14.49 ÷ $34.99 | 41.4% | 2.4x |
| Keep 12% net margin on ad sales | ($14.49 − $4.20) ÷ $34.99 | 29.4% | 3.4x |
| Keep 25% net margin on ad sales | ($14.49 − $8.75) ÷ $34.99 | 16.4% | 6.1x |
Read the table left to right and the trade-off becomes obvious. Every point of margin you protect is a point of ACoS headroom you give up — and headroom is what buys impression share. A brand managing to 16% ACoS on a product whose break-even is 41% is not being disciplined; it is leaving the top of the search page to competitors who understood the same math and chose to spend.
Where a target above break-even is legitimate: a launch phase where you are buying ranking velocity, a defensive brand-term campaign that protects a customer you already paid to acquire, or a product whose repeat-purchase rate makes first-order economics irrelevant. Each of those is a deliberate, time-boxed decision with an exit condition — not a permanent setting.
What is a good ACoS on Amazon?
Once you have your break-even, category benchmarks stop being a target and become a sanity check: are my costs structurally normal for this category, or am I fighting an unusual auction?
Third-party benchmark aggregates published in 2026 put the cross-category average around 32–34% ACoS, with most accounts landing between roughly 25% and 40%. The spread by category is much more informative than the average. Autron's 2026 benchmark set, compiled from industry data and its own managed accounts, reports median ACoS roughly as follows:
| Category | Median ACoS (2026 benchmark data) |
|---|---|
| Food & Grocery | ~23% |
| Toys & Games | ~26% |
| Books | ~26% |
| Electronics | ~30% |
| Beauty & Personal Care | ~31% |
| Pet Supplies | ~31% |
| Sports & Outdoors | ~31% |
| Home & Garden | ~32% |
| Health & Household | ~36% |
| Clothing & Apparel | ~57% |
Treat these as directional. Other aggregators publish narrower ranges for the same categories, and none of them know your price point, your review count or your competitive set. What the table does establish is that a 35% ACoS is a red flag in grocery and unremarkable in health and household — and that anyone quoting a single "good ACoS" number across categories is not looking at the data.
Benchmarking has also become less of a guessing game recently: Amazon added competitive benchmark metrics to its Ads reporting in 2026, so category comparisons can increasingly come from inside the console rather than from third-party estimates.
The three most common ways teams misread ACoS
In audits of accounts in the $50k–$1M/month range, the same three misreadings account for most of the damage.
1. Treating a falling ACoS as a win
ACoS is a ratio, and the cheapest way to improve a ratio is to shrink the denominator's expensive half. Cut bids, pause broad and phrase match, keep only branded and exact-match terms that were converting anyway, and ACoS drops within two weeks. So does new-customer acquisition, so does search-term discovery, and — with a lag of four to eight weeks — so does organic rank, because Amazon's ranking responds to sales velocity that the ads were partly supplying.
The tell is simple: if ACoS improved while total revenue was flat or falling, nothing was optimized. Spend was withdrawn. The honest scoreboard is ACoS and total sales, or better, ACoS alongside TACoS, which prices ad spend against the whole business rather than the ad-attributed slice.
The reverse is what a real improvement looks like. On an outdoor brand we took through a rebuild, ACoS came down from 44% to 21% while revenue grew 68% — the ratio and the denominator moved in the same direction, which only happens when conversion rate, targeting and placement bids improve together rather than budget being pulled.
2. Reading ACoS at the wrong altitude
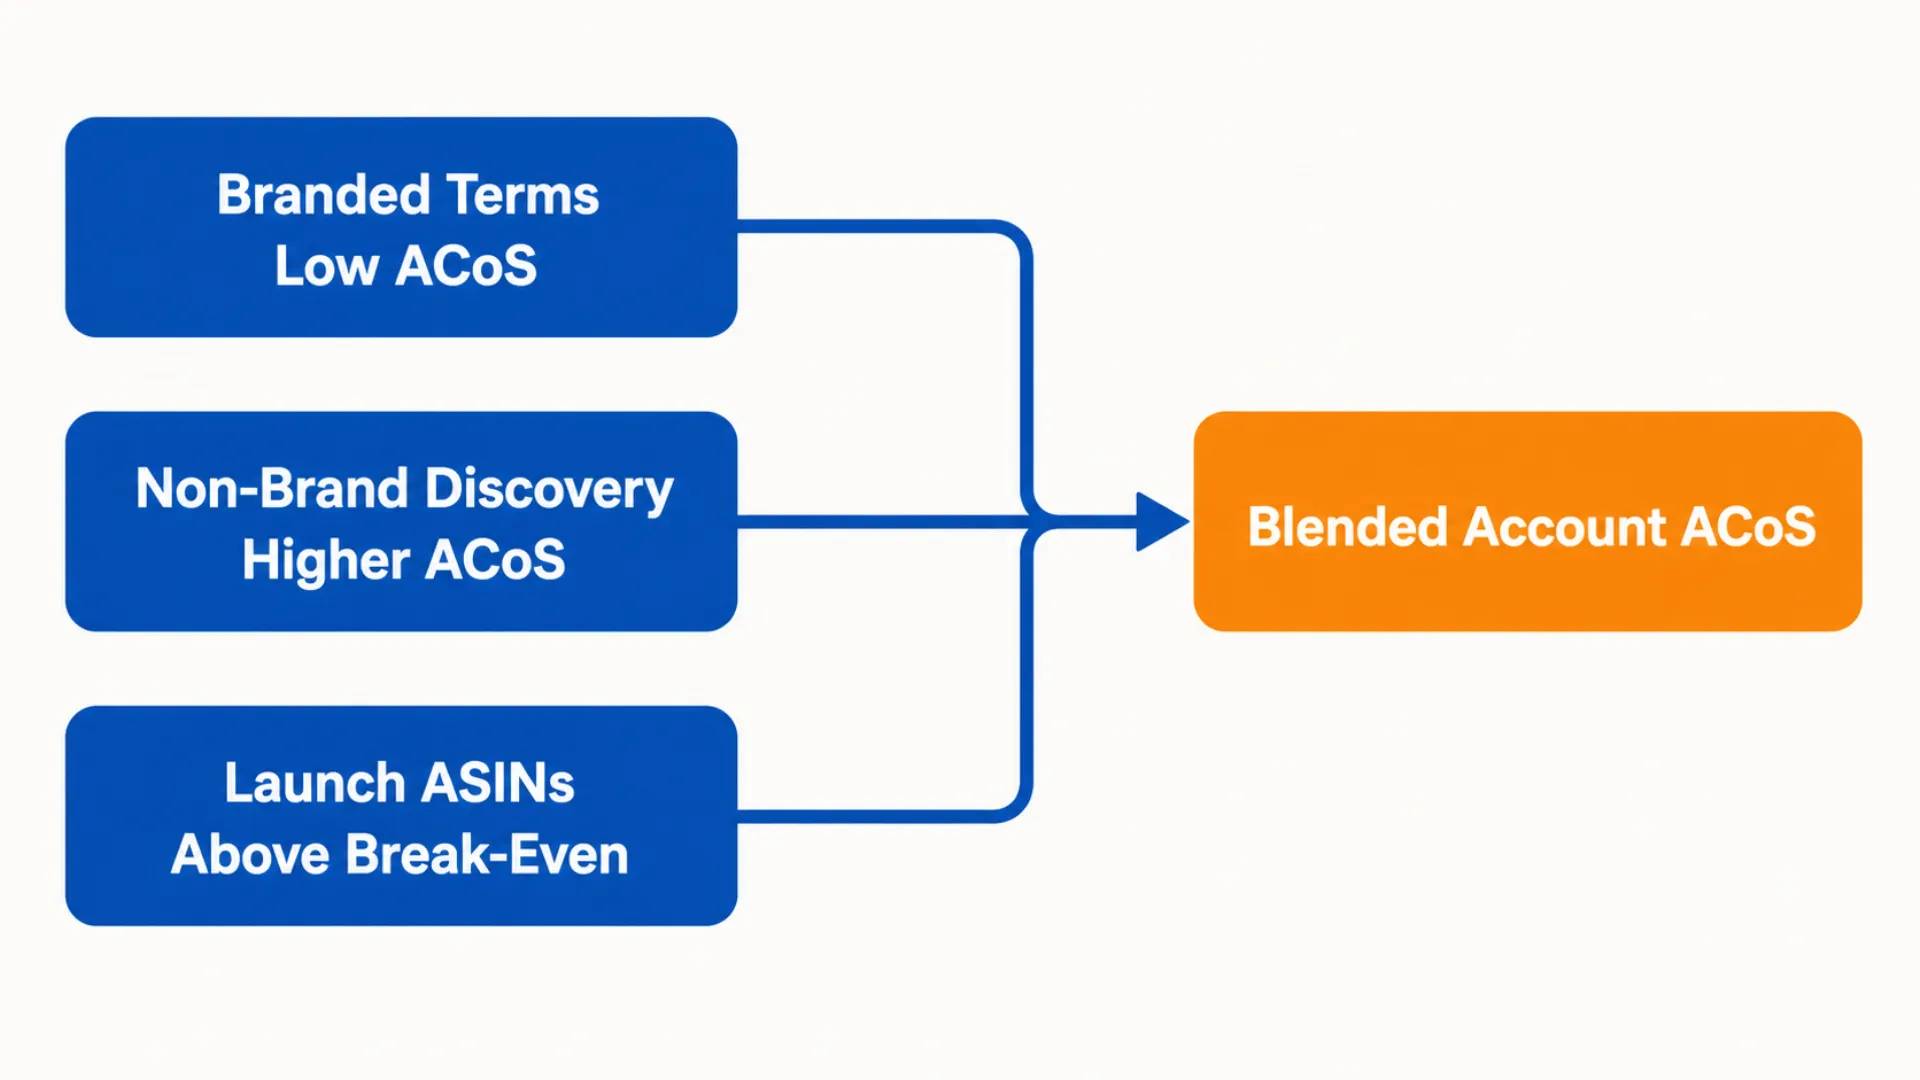
Account-level ACoS is an average of things that should never be averaged. A single number blends:
- branded terms (typically low ACoS, often partly cannibalizing sales you would have had anyway) with non-brand discovery terms (higher ACoS, genuinely incremental);
- hero ASINs at scale with launches deliberately running above break-even;
- Sponsored Products same-SKU attribution with Sponsored Brands and Display halo attribution on a longer window.
Move a dollar between any two of those and the account ACoS changes without a single decision having been made about profitability. ACoS is only actionable at the level where you can act on it: campaign, ad group, targeting, ASIN. That is also why campaign structure is a profitability question and not a housekeeping one — the separation between brand and non-brand is what makes the number readable at all.
3. Judging ACoS before attribution has settled
Because Sponsored Products credits sales on the date of the click within a 7-day window, today's ACoS for yesterday is always the worst it will ever look. Teams that review a campaign 48 hours after a bid change routinely conclude it failed, cut the bid, and repeat the cycle — optimizing against noise.
Practical rule: don't evaluate Sponsored Products performance on a window shorter than 8 days, or Sponsored Brands and Display on less than 15. Compare full weeks to full weeks so day-of-week effects cancel. And when you make a bid or budget change, note the date, then read the result once — not daily.
There is a fourth misreading that is really a category error: expecting ACoS to tell you about the business. It cannot. ACoS is blind to organic sales, to repeat purchase, to subscribe & save, to the sale a shopper makes 30 days later. Those live in TACoS and in contribution margin at the P&L level, and a brand that steers only by ACoS will systematically underinvest in the top of the funnel.
How to actually move ACoS
Ordered by how much they typically move the number, and how quickly:
- Conversion rate on the destination page. ACoS falls when the same clicks produce more orders. Main image, price relative to the comparison set, review count and the first two bullets do more for ACoS than any bid change — and unlike bids, the effect compounds into organic rank.
- Search-term hygiene. Pull the search term report weekly, negate terms that spend past break-even without converting, and promote proven converters into exact match at a bid you set deliberately.
- Placement and bid strategy. Top-of-search placements convert better and cost more; whether that trade is worth it is an arithmetic question you can answer per campaign from the placement report.
- Price and unit economics. A $2 price rise or a renegotiated freight rate widens contribution margin, which raises break-even ACoS, which makes campaigns that were marginal profitable — without touching the ad account at all.
If you want to work through your own account before changing anything, the Amazon growth plan covers the same ground we cover in the first two weeks of an engagement, and our Amazon PPC management work always starts from the break-even table above rather than from a target ACoS someone inherited.
FAQ
Is a 30% ACoS good?
It depends entirely on your contribution margin. If a unit contributes 40% of its price after COGS, referral and FBA fees, then a 30% ACoS leaves roughly 10 points of profit per advertised sale — healthy. On a 25% margin, the same 30% ACoS loses money on every order. Calculate break-even first.
What does a 100% ACoS mean?
It means you spent exactly as much on ads as the ads generated in attributed sales — one dollar of spend for one dollar of revenue, before any product cost or Amazon fee. Every such sale loses money outright unless it is a deliberate launch investment or the product has strong repeat-purchase economics behind it.
How do I calculate break-even ACoS?
Subtract landed COGS, the Amazon referral fee, the FBA fulfillment fee and a returns allowance from your sale price. Divide the result — your contribution margin per unit — by the sale price. That percentage is your break-even ACoS: the point where an advertised sale contributes exactly zero profit.
Why is my ACoS suddenly higher?
Common causes, in order of likelihood: a competitor raised bids in your auction, your conversion rate dropped (price change, lost buy box, review dip, out of stock variation), attribution has not settled for the period you are looking at, or budget shifted toward non-brand discovery campaigns that naturally run at a higher ACoS.
Is ACoS the same as ROAS?
They are the same relationship inverted. ACoS = 1 ÷ ROAS, so 25% ACoS equals 4x ROAS and 50% equals 2x. Amazon reports ACoS by default in Seller Central; agencies used to Google or Meta usually report ROAS. Neither contains information the other lacks.
Where to start this week
Pick your top five ASINs by ad spend and build the break-even table above for each one — real landed cost, real fee preview from Seller Central, a realistic returns allowance. Then compare each product's actual trailing 30-day ACoS to its own break-even, not to a category average.
You will usually find two things: a product being managed far below its break-even that could profitably absorb more spend, and one quietly running above it. Fixing that mismatch is normally worth more than a month of bid optimization.