How to Increase Amazon Sales: The 6 Levers That Actually Move Revenue
Revenue on Amazon comes from six levers, and a stalled account is usually stuck on two of them. A diagnostic walk through all six, with what to check first in your own data.


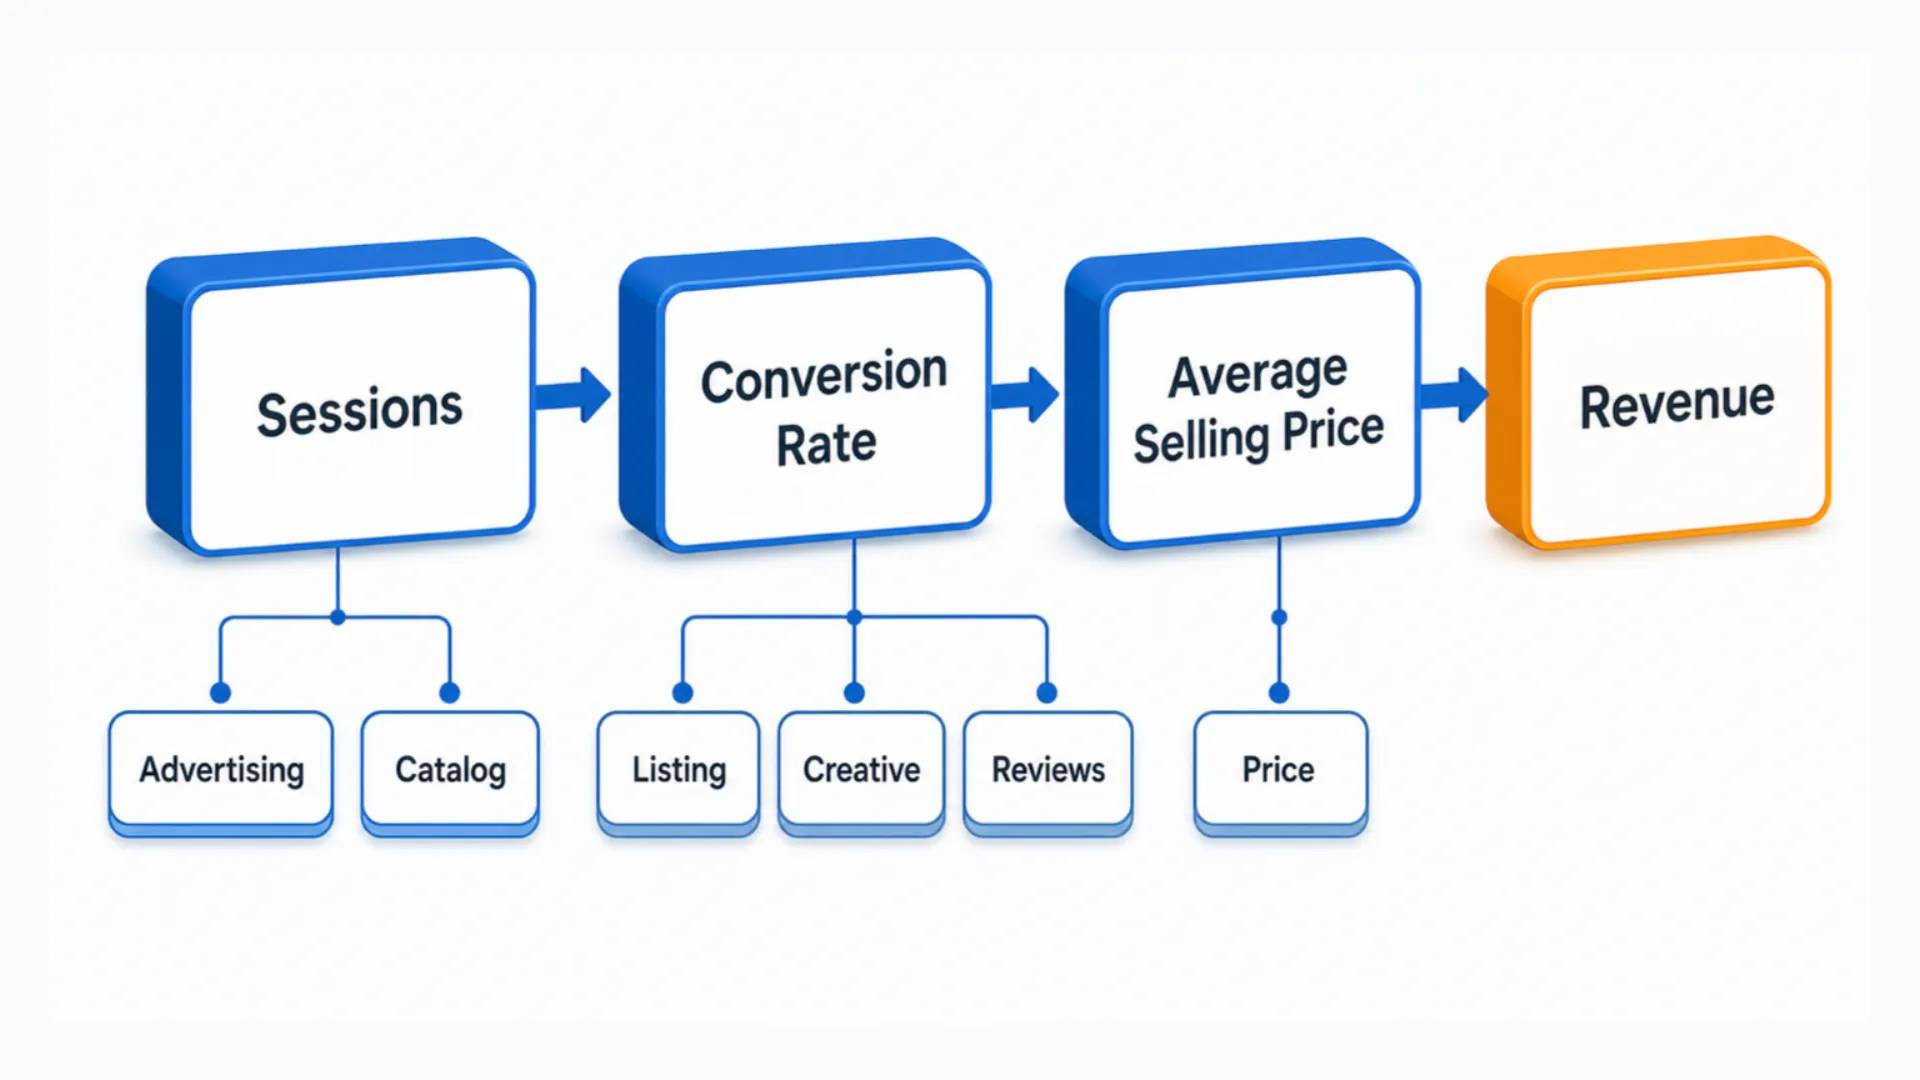
To increase Amazon sales you have exactly six levers to pull: advertising, listing and SEO, creative and conversion, catalog breadth, price, and reviews. Revenue is traffic multiplied by conversion multiplied by price, and every one of those six inputs feeds one of those three numbers. Most stalled accounts are not broken across the board — they are stuck on two levers while the other four are quietly fine, and the whole job is figuring out which two.
Why accounts stall at a ceiling
A brand that grew on its own usually grew by doing two or three things unusually well. That works until the thing you did well is saturated: your best keywords are already bought, your hero product already ranks, your budget already clears. Sales flatten, and the instinct is to push harder on the lever that used to work — more spend on the same campaigns, another round of keyword tweaks — which is exactly the lever with the least headroom left.
The arithmetic is worth writing out, because it tells you where to look.
| Input | What moves it | Symptom when it is the bottleneck |
|---|---|---|
| Sessions | Advertising, organic rank, catalog breadth | Flat or falling sessions while conversion holds |
| Conversion (unit session %) | Images, A+, price, reviews, offer | Sessions grow, units do not |
| Average selling price | Pricing, bundles, variation mix | Units grow, revenue does not |
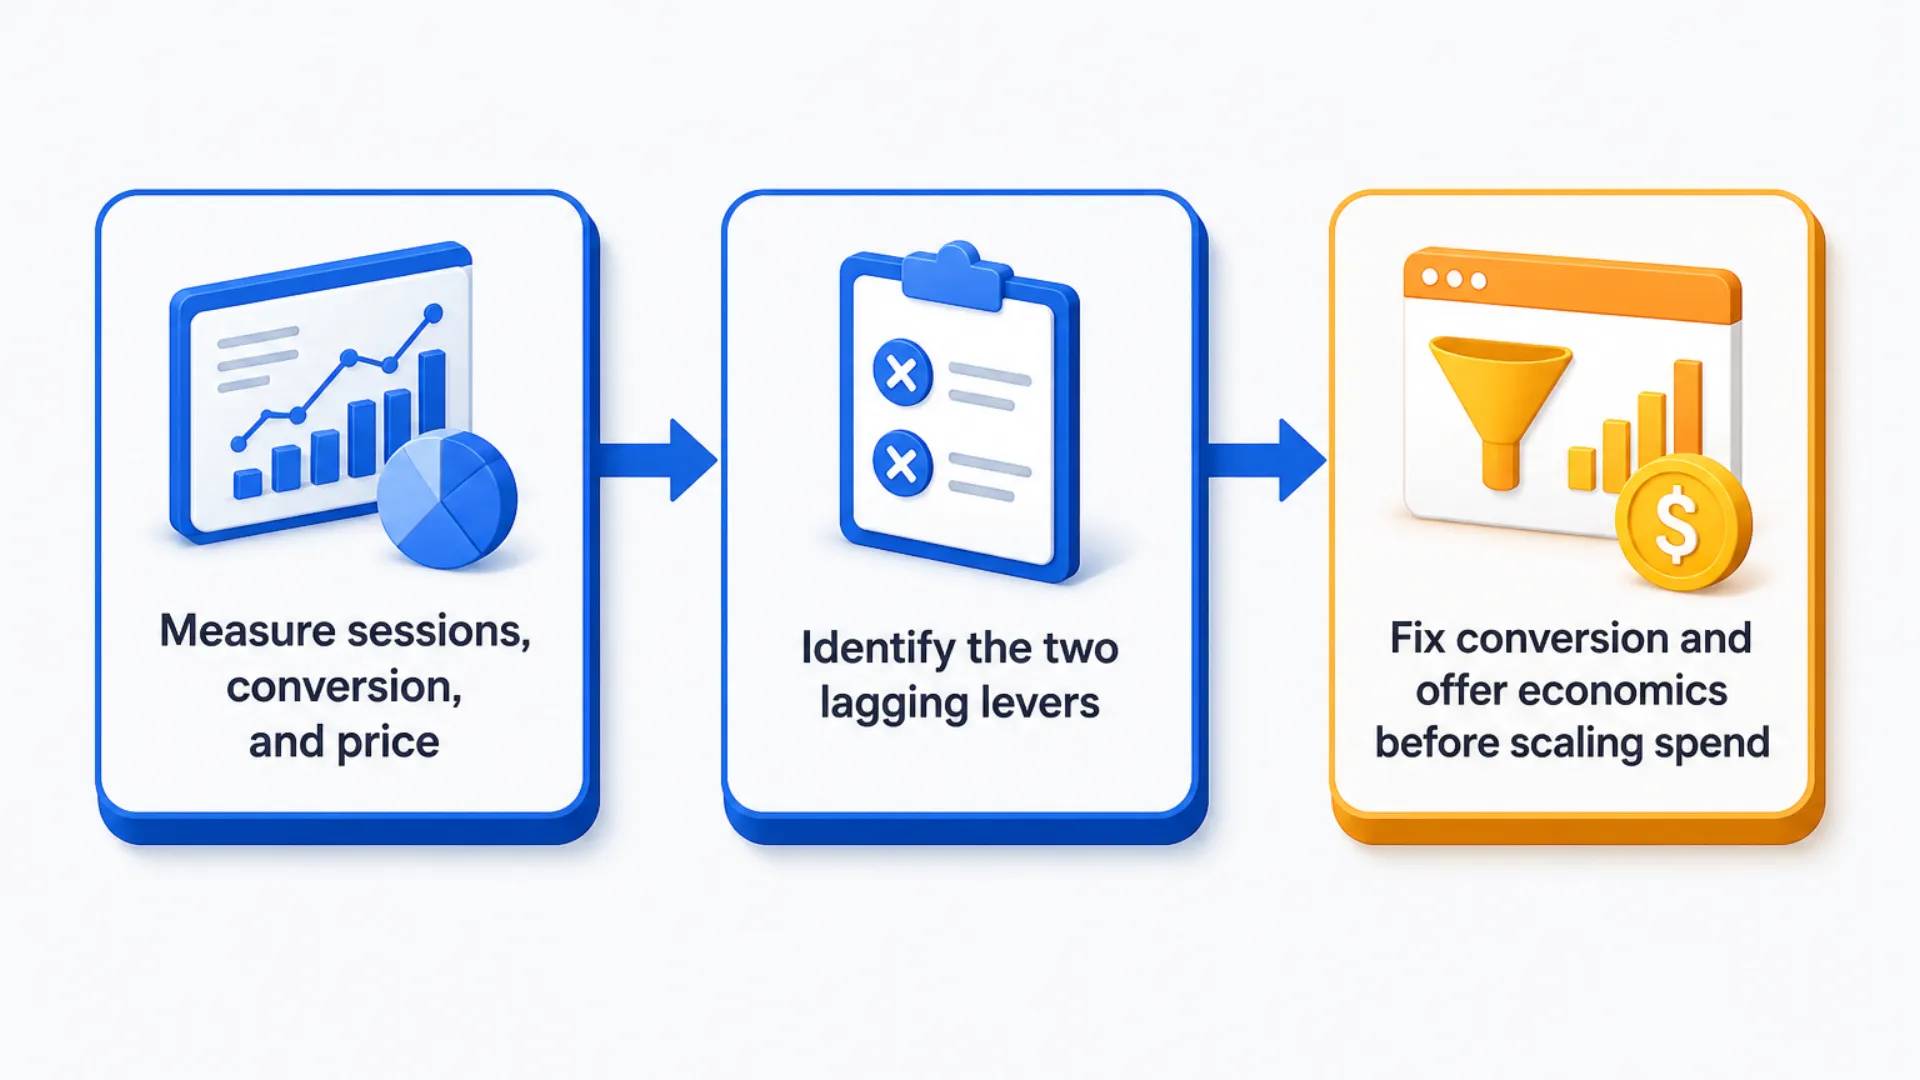
Pull your Business Reports in Seller Central for the last 12 months at the child-ASIN level, put sessions, unit session percentage and average selling price side by side, and the flat line will be in one of the three columns. That single view narrows six levers down to two or three before you have looked at a single campaign.
Lever 1 — Advertising: are you buying all the traffic you can profitably buy?
Advertising is the fastest lever and the most commonly misdiagnosed one. The question is not "is my ACoS good" — it is whether there is profitable traffic you are choosing not to buy.
How to tell it is your bottleneck. Check three things: how many hours a day your top campaigns sit out of budget, what your impression share looks like on your ten highest-intent search terms, and how much of your ad revenue comes from branded terms. A portfolio that runs out of budget by mid-afternoon, or where most ad sales are people already searching your brand name, has an advertising ceiling, not a performance problem.
What to do first. Separate branded from non-branded campaigns so you can see your real cost of acquiring a new customer, then raise budgets only on the campaigns that convert above your category norm. Third-party benchmark compilations for 2026 put average Sponsored Products CPC roughly in the $0.85–$1.30 range, with category medians spanning from well under $0.50 in books to over $2.00 in beauty and supplements — so judge your CPC against your category, never against a blended platform average. The mechanics of campaign types, match types and harvesting are covered in Amazon PPC explained; if performance actively degraded rather than plateaued, the diagnostic list in why your Amazon ads stopped working is the faster read.
Efficiency and growth are not opposites here. On an outdoor brand we took ACoS from 44% to 21% while revenue grew 68% — the spend that disappeared was spend on terms that were never going to convert, and the freed budget went into the terms that already did.
One note on scale: if your ad spend is well into five figures a month and you are already saturating Sponsored Products, DSP becomes the next inventory to buy. Amazon removed the minimum spend requirement on self-service DSP at unBoxed in 2025, so access is no longer the gate — signal volume is. Practitioners generally cite around $10,000 a month as the point where the model has enough conversion data to optimize; Amazon's fully managed DSP service still starts around $50,000 a month.
Lever 2 — Listing and SEO: rank for demand you are not showing up for
Advertising buys traffic. Organic rank compounds it. If your ad sales are healthy and your organic sales are flat, you are renting your entire demand curve.
How to tell it is your bottleneck. In Brand Analytics, open Search Query Performance and compare your impression share to your purchase share on your top query set. Terms where you convert well but barely register on impressions are terms you are not indexed or not ranked for — that is unclaimed revenue sitting in plain sight. The other tell is a high ratio of ad-attributed to total sales that has not moved in a year.
What to do first. Fix indexation before you fix phrasing: a keyword that appears nowhere in the title, bullets, backend search terms or A+ copy cannot rank no matter how good the copy is. Then work the terms where you already have relevance and rank on page two — moving from position 15 to position 5 on an existing term is far cheaper than manufacturing relevance for a term you have no history on. How Amazon ranking actually works covers the relevance and velocity mechanics in detail.
Two things changed in 2026 and both favor listings with dense, factual attributes. Amazon folded its Rufus assistant into Alexa for Shopping in May 2026, putting AI-generated answers directly above search results, and the assistant assembles those answers from listing attributes, bullets, A+ content and Q&A rather than from keyword density. Practically, that rewards listings that answer specific buyer questions in plain sentences — dimensions, materials, use cases, compatibility, who it is not for. Rebuilding a catalog on that principle moves organic sales without a change in ad budget, which is the cleanest revenue there is.
Lever 3 — Creative and conversion: the cheapest revenue you will ever find
Conversion is the highest-leverage number on the page because it multiplies every other lever. A move from 10% to 12% is a 20% revenue increase on identical traffic and identical spend, and it lowers your ACoS at the same time.
How to tell it is your bottleneck. Compare your unit session percentage to your category. Third-party benchmark data for 2026 puts the platform average around 9–12%, with well-optimized listings in the 12–18% band. If you are sitting below your category median while sessions are healthy, the page is the problem, not the traffic.
What to do first. In priority order: main image, then title, then the image stack, then A+. Amazon's own published figures for A+ content are an up-to-8% sales lift for standard A+ and up to 20% for Premium A+ — both are ceilings from internal Amazon studies with no published methodology, so treat them as directional rather than as a forecast. Premium A+ has stayed free through 2026 for brand-registered sellers who meet the Brand Story and approved-content requirements, which makes it one of the few genuinely free conversion levers left.
Then stop guessing. Manage Your Experiments (Seller Central → Brands → Manage Experiments, as of Q3 2026) lets brand-registered sellers A/B test titles, images and A+ on ASINs with enough traffic to reach significance. Run one test at a time, let it run its full course rather than calling it early, and keep a written log of what won — the log is worth more after a year than any single test. What to put in the queue is laid out in Amazon conversion rate optimization.
Lever 4 — Catalog breadth: more shelf, not just more traffic per shelf
At some point a single hero ASIN is fully optimized and the growth has to come from somewhere else on the shelf. Catalog breadth is the slowest lever and the one with the highest ceiling.
How to tell it is your bottleneck. If one ASIN is more than half your revenue, if your best sellers are all in one size or one flavor, or if you sell only in the US while your category has obvious demand in Canada, Australia or the UK, breadth is where your next million is.
What to do first. The cheapest expansion is usually variation family completeness — sizes, counts, scents, multipacks — because a well-built variation family concentrates reviews and rank on a single parent instead of splitting them across orphan listings. Next cheapest is a marketplace expansion into a country where the same listing, translated and re-priced, meets existing demand. A bath and body brand we work with grew Amazon revenue 363% and opened Canada largely on that combination. New product development is the highest-ceiling and slowest version of this lever, and it should never be the first one you reach for while conversion or advertising still has obvious headroom.
Lever 5 — Price and offer: the lever that moves three numbers at once
Price is the only lever that changes traffic, conversion and margin simultaneously, which is why it is both powerful and dangerous.
How to tell it is your bottleneck. Two signals. First, Featured Offer share: if you are losing the Featured Offer, or your listing is showing "See All Buying Options" instead of Add to Cart, conversion collapses regardless of how good the page is — third-party estimates consistently attribute the large majority of Amazon purchases to the Featured Offer. Second, break-even math: work out what you actually keep per unit after Amazon's published referral fee — 15% in most categories with a $0.30 minimum, with notable exceptions like 8% on consumer electronics — plus FBA fulfillment, storage, returns and COGS. Plenty of accounts are not slow, they are simply advertising at a target that their unit economics cannot pay for.
What to do first. Calculate true profit per unit before you touch the price, then find your ceiling — the highest price at which you still hold the Featured Offer — rather than reflexively matching the lowest offer. Test price in one direction at a time and give it two full weeks; price changes move rank with a lag, so a three-day read is noise. If your competitors are unauthorized resellers rather than brands, the fix is usually enforcement and catalog control, not a price cut.
Lever 6 — Reviews and social proof: the constraint you cannot fix in a week
Reviews are a conversion input with a long lead time, which is why they belong last in the list and first in your calendar.
How to tell it is your bottleneck. Compare review count and star rating against the three offers that outrank you on your money keyword. A gap of a few hundred reviews at the same rating usually means you are paying more per conversion than they are — you can see it as a persistently below-category conversion rate that image and A+ tests fail to move.
What to do first. Use the free tools before the paid ones: "Request a Review" on every eligible order (it is automatable through approved tools), package inserts that comply with Amazon's communication policy, and fast, non-defensive responses to negative reviews with a fix described in plain language. For new or relaunched ASINs, Amazon Vine is the only sanctioned accelerator; enrollment is per parent ASIN and tiered — free for up to 2 reviews, $75 for up to 10, $200 for up to 30 at the time of writing — and the ASIN must have fewer than 30 existing reviews to qualify. Amazon has revised the tier table more than once, so confirm the current numbers in Seller Central before you budget.
Also read your one- and two-star reviews as product feedback rather than as PR. Three reviews complaining about the same missing detail are usually a bullet point or an image you should have had, and fixing that raises conversion for everyone who never leaves a review at all.
How to increase Amazon sales: find your two levers in an afternoon
Run this in order. It takes a few hours and it will point at two of the six.
| Symptom in your data | The lever it points to |
|---|---|
| Sessions flat, conversion healthy | Advertising, then listing/SEO |
| Campaigns out of budget daily, ACoS below target | Advertising (budget, not efficiency) |
| High impression share on ads, low organic rank | Listing/SEO |
| Sessions up, units flat | Creative and conversion |
| Conversion below category, Featured Offer unstable | Price and offer |
| Conversion below category, review gap vs top three offers | Reviews |
| One ASIN over half of revenue | Catalog breadth |
Two rules make the difference between a plan and a list. First, fix conversion before you scale spend — pouring budget onto a page that converts below category multiplies the wrong number. Second, work no more than two levers per quarter; running six workstreams at once means you will never know which one worked. Coordinating those levers so advertising, listing, creative and catalog decisions stop contradicting each other is the whole point of full account management, and it is also the thing a fragmented setup — one freelancer on ads, one on design — reliably fails at.
If you would rather have the diagnosis done for you, our Amazon growth plan runs the same six-lever check across your account and returns the two that are actually costing you revenue.
FAQ
How long does it take to increase Amazon sales?
Advertising changes show up within one to two weeks. Listing and SEO work typically takes 30–90 days to fully re-rank, since Amazon needs sales velocity on the new terms. Conversion tests through Manage Your Experiments need several weeks to reach significance, and reviews and catalog expansion are quarter-scale projects. Plan in quarters, measure in weeks.
Why did my Amazon sales drop suddenly?
A sudden drop is almost always one of five things: lost Featured Offer, a suppressed or stranded listing, a competitor's price or promotion, campaigns running out of budget, or an inventory stockout that reset your rank. Check listing status and Featured Offer share first — those explain most overnight drops, while gradual declines point to rank or conversion.
Does increasing ad spend increase Amazon sales?
Only where there is unbought profitable traffic. If your campaigns run out of budget before the day ends and convert above your category norm, more budget buys more sales directly. If your best campaigns already spend their full budget and your conversion rate is below category, extra spend raises cost per acquisition without moving revenue much.
What is a good conversion rate on Amazon?
Third-party benchmark compilations for 2026 put the platform average at roughly 9–12%, with well-optimized listings reaching 12–18%. Category matters more than the average: food and beverage routinely converts far higher than electronics. Compare your unit session percentage to your own category and to the offers outranking you, not to a blended number.
Do more reviews increase Amazon sales?
Yes, but rating and recency matter more than raw count. Once a listing has a few hundred reviews, adding more moves conversion far less than lifting a 4.2 rating to 4.5 or resolving the complaint that repeats across recent reviews. For new ASINs, review volume is a genuine constraint; for established ones, it is usually not the real bottleneck.
How do I increase Amazon sales without lowering my price?
Work conversion and traffic instead. Improve the main image and title, complete the variation family, close indexation gaps on high-intent search terms, and fund campaigns that already convert above category. Price cuts move volume but compress margin permanently and are hard to reverse without hurting rank, so treat price as the last lever.
Where to start on Monday
Open Business Reports at child-ASIN level for the last 12 months and find whether sessions, conversion or average selling price is the flat line. Then take the two levers your data points at and nothing else.
- Pull sessions, unit session percentage and average selling price by ASIN; identify the flat input.
- Check Featured Offer share and true profit per unit — if either is broken, fix it before any growth work.
- Pick two levers for the quarter, write down the metric each one is supposed to move, and check it in 30 days.