
Measuring a 19-day decision with a 7-day report
Account return on spend 2.1x → 4.8x
Nobody buys a $460 phone in one session. The brand was judging campaigns on a report window shorter than its own customers' decision, and switching off everything that builds demand.

At a glance
- Category
- Unlocked Cell Phones
- Marketplaces
- US
- Revenue at start
- $540k / month
- Average selling price
- $460
- Lag signal
- 14-day attributed sales 62% above the 7-day figure
- Engagement
- PPC + account management
- Timeframe
- 13 months
Results
The challenge
A $460 phone is researched. Buyers read comparisons, check storage options, wait for a paycheck, come back three times. Even inside the reports the console does provide, two fifths of attributed sales arrived after day seven — and whatever lands beyond day fourteen is not reported at all.
The brand optimized on a seven-day report. Everything measured inside that window looked like a loss except the narrowest bottom-funnel terms, so over two years the account had been pruned down to exactly those: model-name-plus-storage searches by people who had already decided. Spend was efficient and the business had stopped growing, because every campaign that introduced the brand to a new buyer was switched off within two weeks of launch for failing a test it could not pass.
Our approach
We changed the measurement before changing the spend.
- The yardstick changed to total-account economics — total sales against total spend on a rolling 28 days — because the console attributes seven and fourteen days and no setting extends that.
- Two separate budgets — a discovery budget judged on new-to-brand orders and assisted revenue, a harvest budget judged on immediate return.
- Upper-funnel terms reinstated with a minimum eight-week evaluation period, protected from being cut on one bad two-week stretch.
- Switch-back tests on the discovery campaigns, eight weeks on and four off, which is the only way to see a lag this long without per-user data.
How we worked
- 1
Measuring the lag
Read out of the reports themselves: 14-day attributed sales ran 62% above the 7-day figure, and the switch-back tests showed the real tail is longer still.
- 2
Rebuilding the reports
Weekly reporting rebuilt on total sales, total spend and new-to-brand orders, so a campaign is not judged by a window shorter than the decision.
- 3
Reinstating discovery
Comparison, category and specification searches restarted with their own budget and their own success criteria.
- 4
Protecting the test
An eight-week minimum before any discovery campaign can be paused, agreed in writing to stop the reflex.
- 5
Rebalancing
Discovery grown to a third of spend once the cohort data showed it profitable on a full window.
Inside the ad account
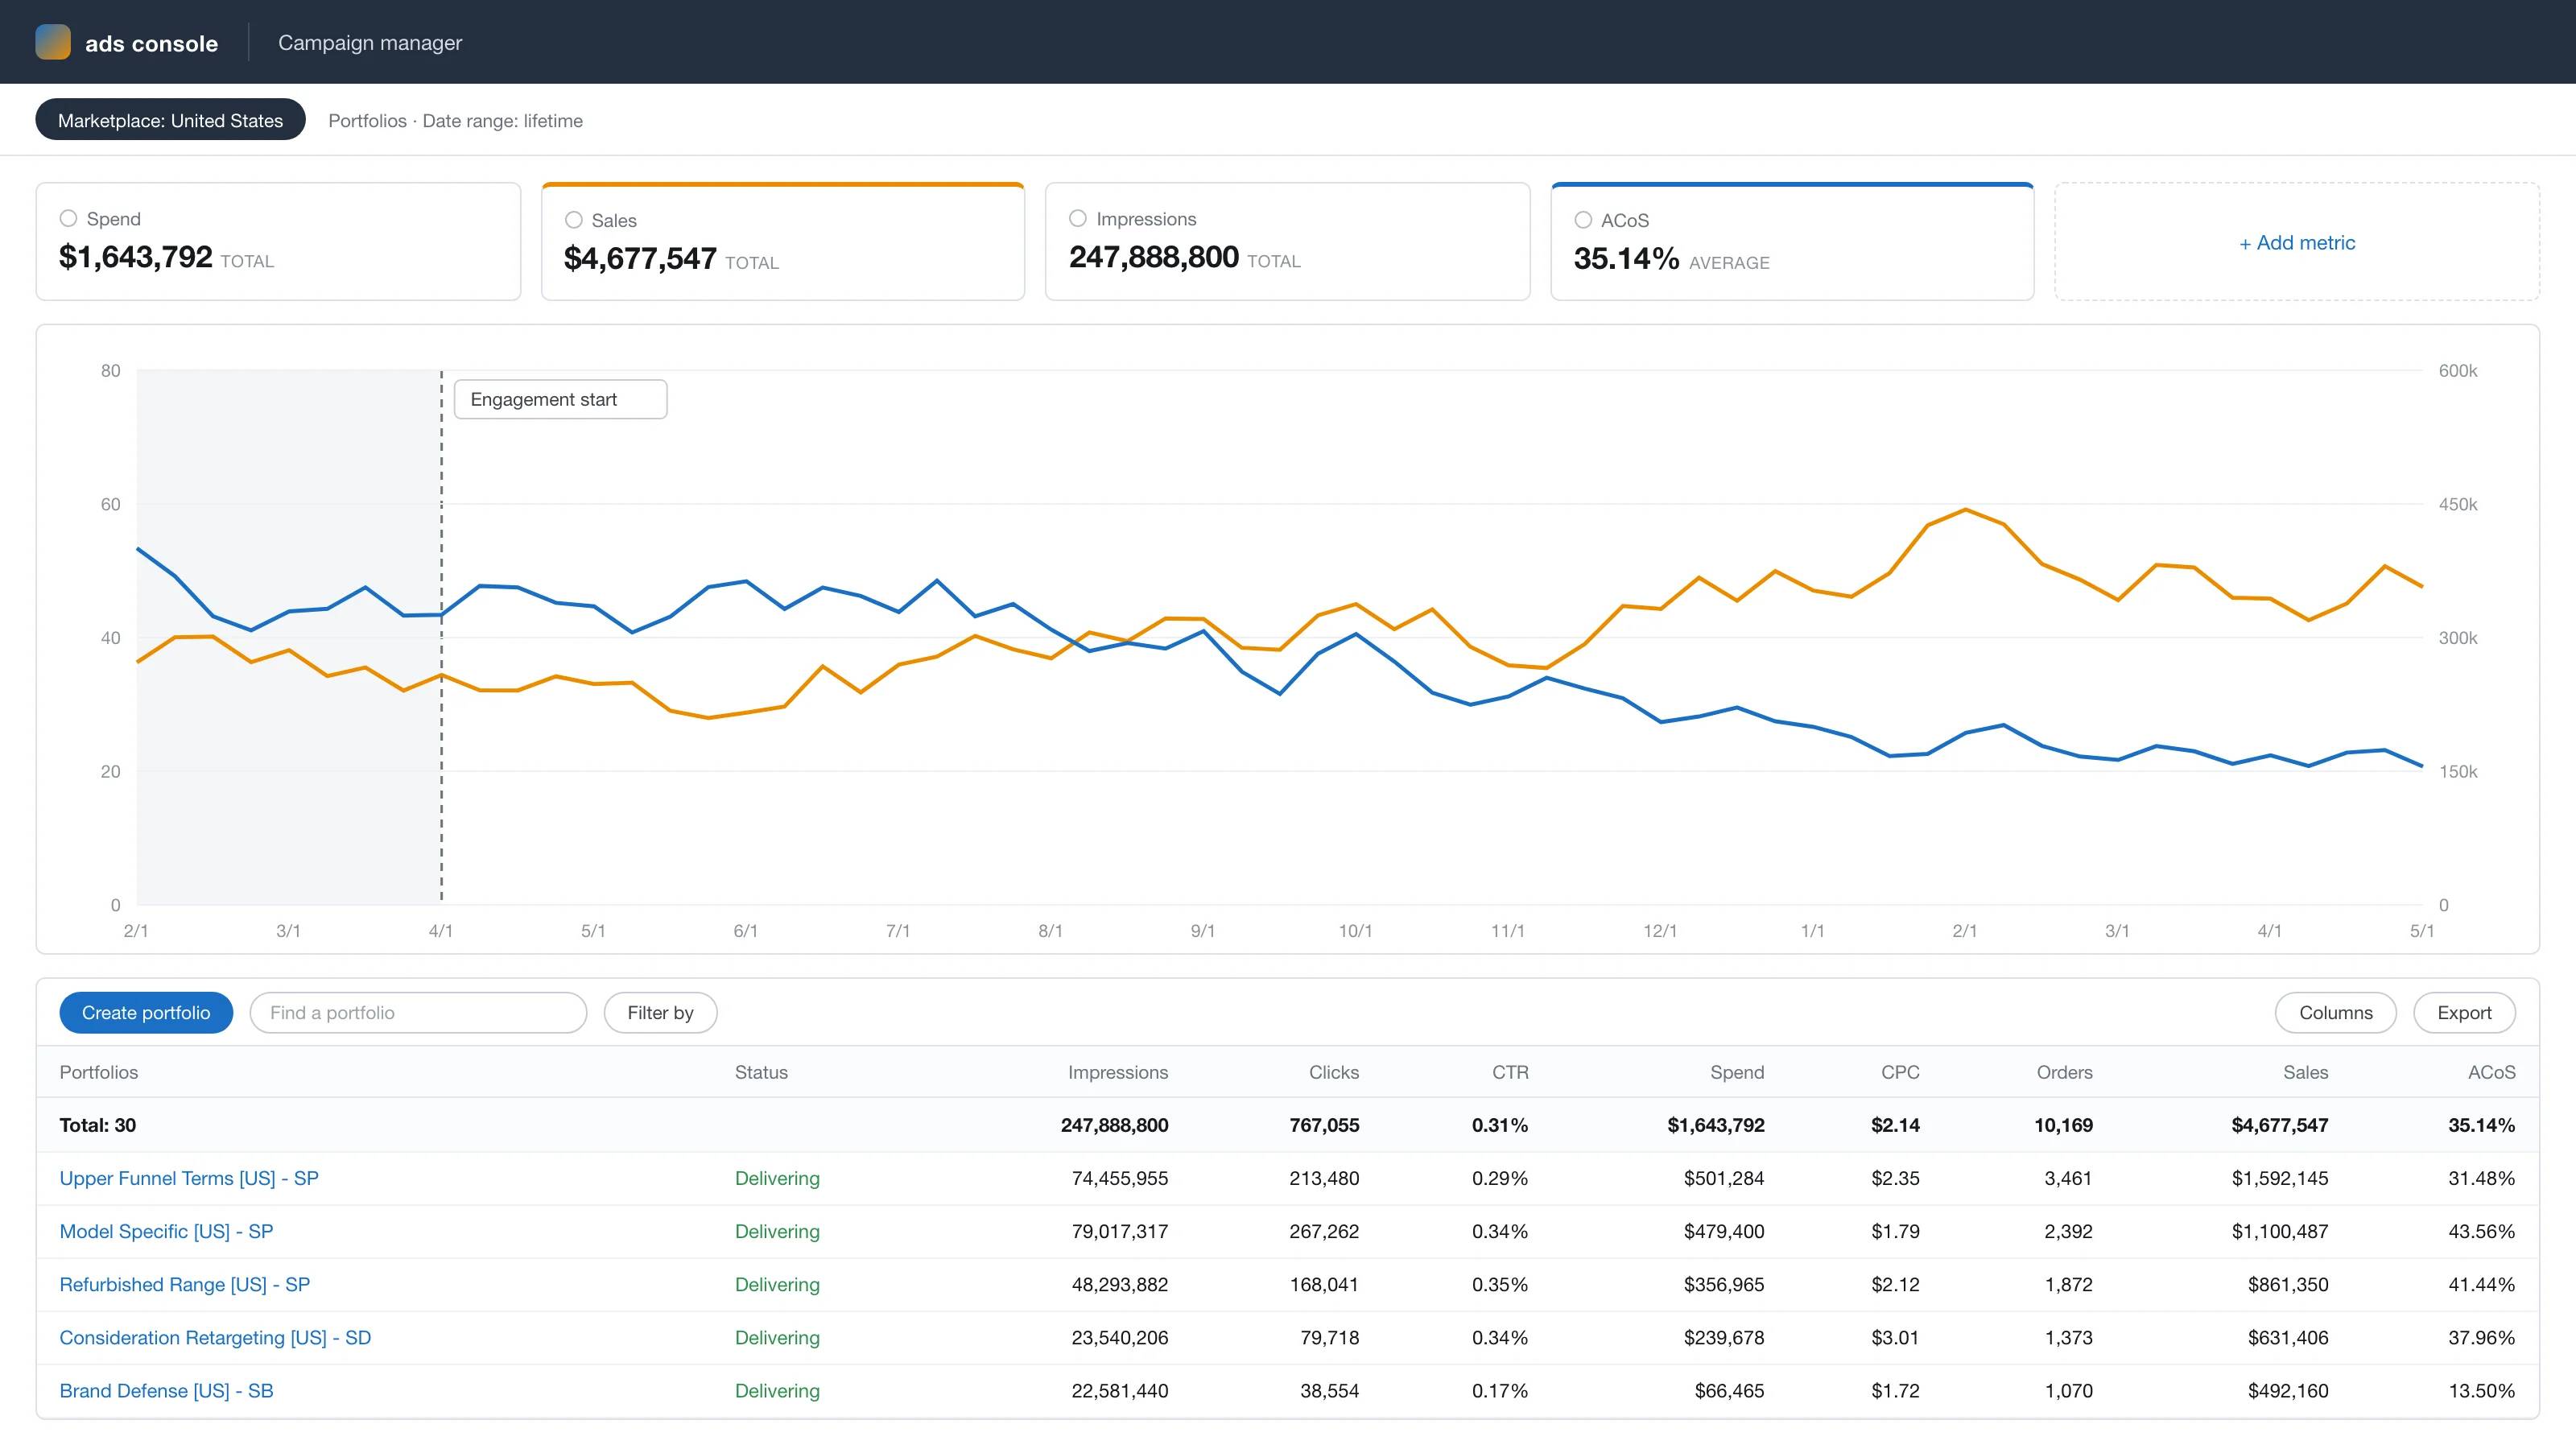
Anonymized account view, rebuilt from the figures reported above: ad sales growing from $243k to $410k a month while ACoS falls from 48% to 21% across the 13-month engagement.
The results
Measured as total sales over total spend, the account returns 4.8x where the seven-day attributed report had been showing 2.1x — most of that gap was always there and simply outside the window the console reports.
Revenue grew 69% and new-to-brand orders nearly tripled, because a third of the budget is now spent introducing the brand to people who have not decided yet. The old approach was not wrong about its numbers; it was reading a seven-day window on a decision that takes weeks, and concluding that demand generation does not work.
“We had spent two years cutting everything that did not pay back in a week, in a business where nobody decides in a week.”
Services we delivered
Related case studies




Ready to scale your Amazon brand?
Talk to a senior strategist and leave with a growth plan for your store — no obligation.