
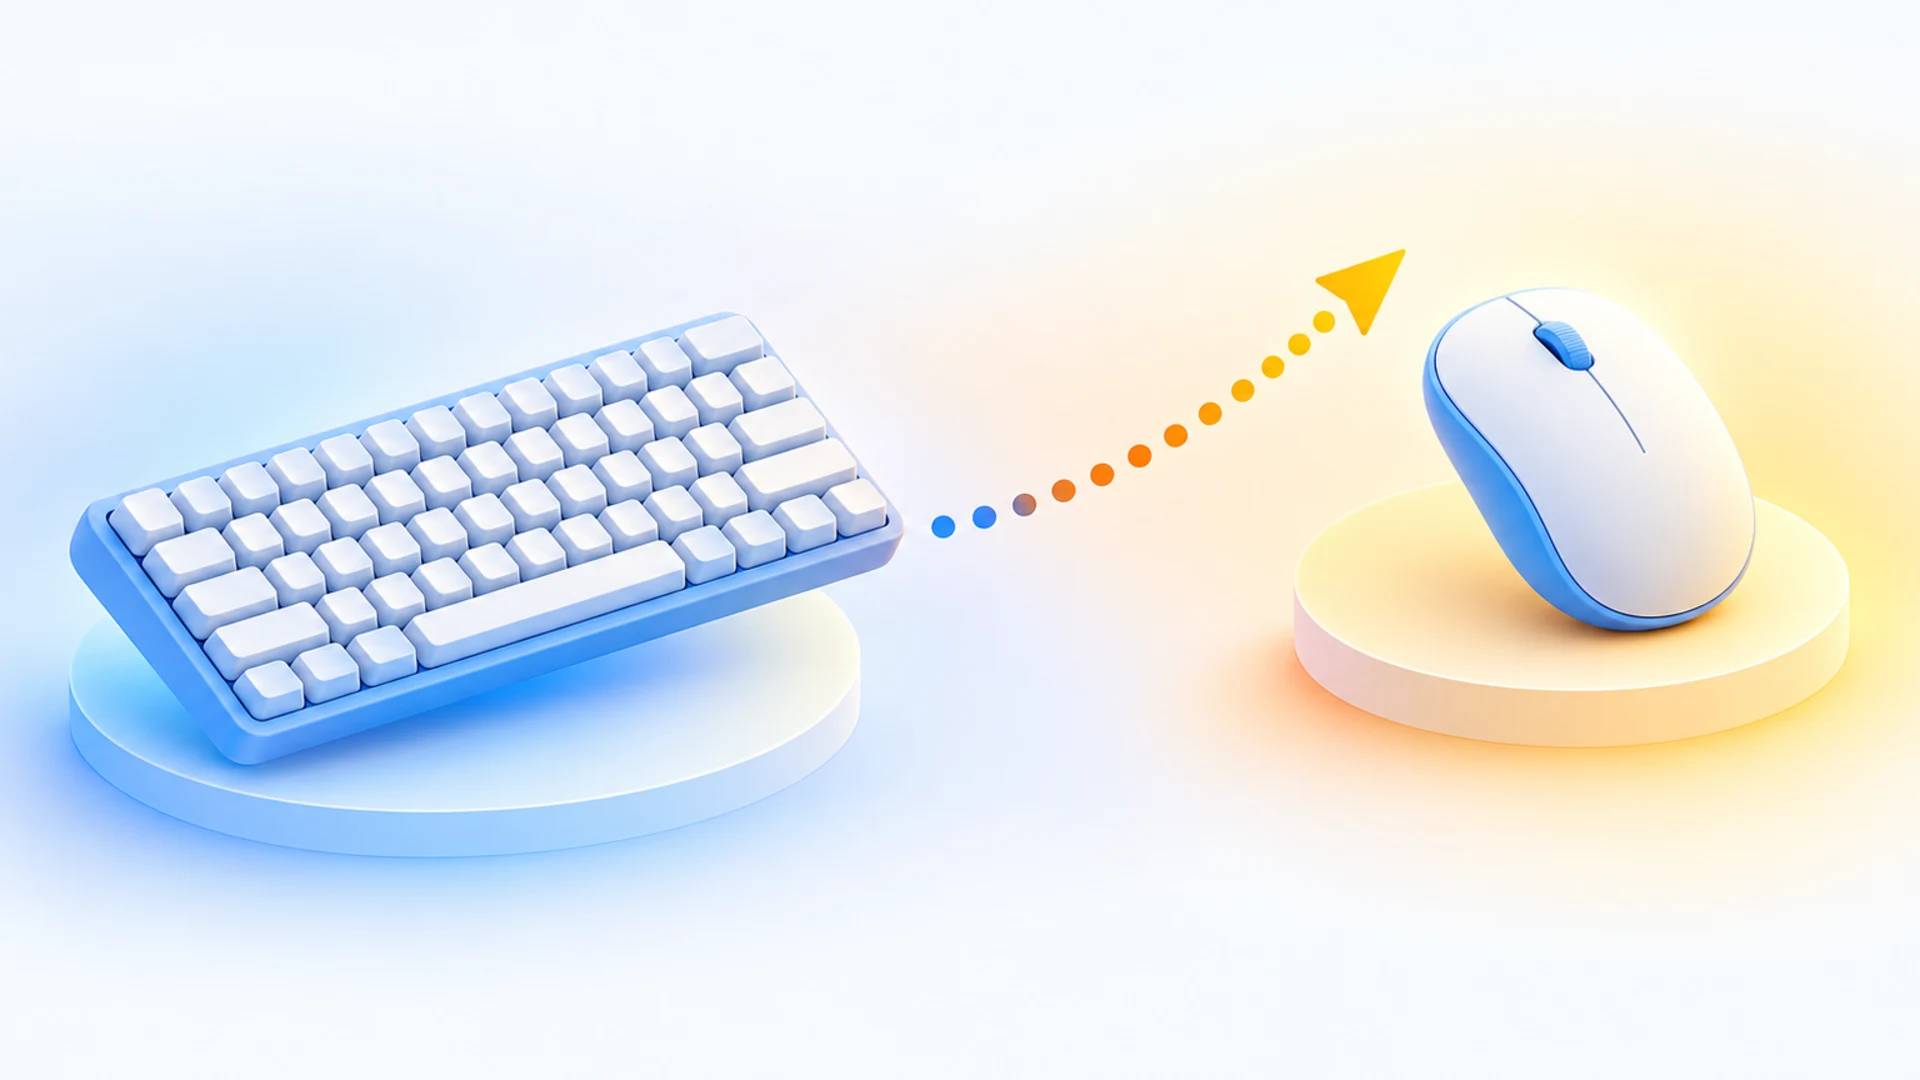
Selling the mouse to the person who bought the keyboard nineteen days ago
Second purchase rate 9% → 31%
A PC peripherals brand sold one item per customer in a category where people build a setup piece by piece over months. The order of those purchases turned out to be predictable.
At a glance
- Category
- PC Gaming Gear
- Marketplaces
- US
- Revenue at start
- $187k / month
- Pattern
- 91% of customers bought once and never returned
- Engagement
- DSP + account management
- Timeframe
- 7 months
Results
The challenge
A gaming setup is assembled over months, not bought in one order: the monitor comes first, the keyboard a few weeks later, then the mouse, the headset and the pad. The brand sold all five categories and almost never sold two of them to the same person.
Its advertising treated each product as a separate acquisition problem, competing for the same cold search traffic five times over and paying full price each time. Meanwhile the warmest audience it had — people who had bought one of its products and were demonstrably still building — was reached by nothing at all.
Our approach
We mapped the order and then advertised to it.
- Sequence analysis in Amazon Marketing Cloud, the only place a per-customer order sequence exists — the median gap between first and second purchase per pair came out at nineteen days for keyboard → mouse and about six weeks for monitor → keyboard.
- DSP audiences of the brand's own recent buyers, activated at the gap rather than immediately after purchase.
- Creative that assumes the first product — the ad shows the piece they already own next to the piece they don't.
- Search budget held flat, so the growth could be attributed to the sequence work rather than to more cold traffic.
Timeline
Sequence mapping
- Purchase sequences measured in AMC, pair by pair
- Keyboard → mouse measured at nineteen days
- Audiences defined per pair
First flights
- Post-purchase DSP activated at the measured gap
- Creative built around the item already owned
- Search budget deliberately held flat
Scale
- Winning pairs given their own always-on flights
- Third-purchase audiences added behind the second
- Reporting switched to revenue per customer
Inside the ad account
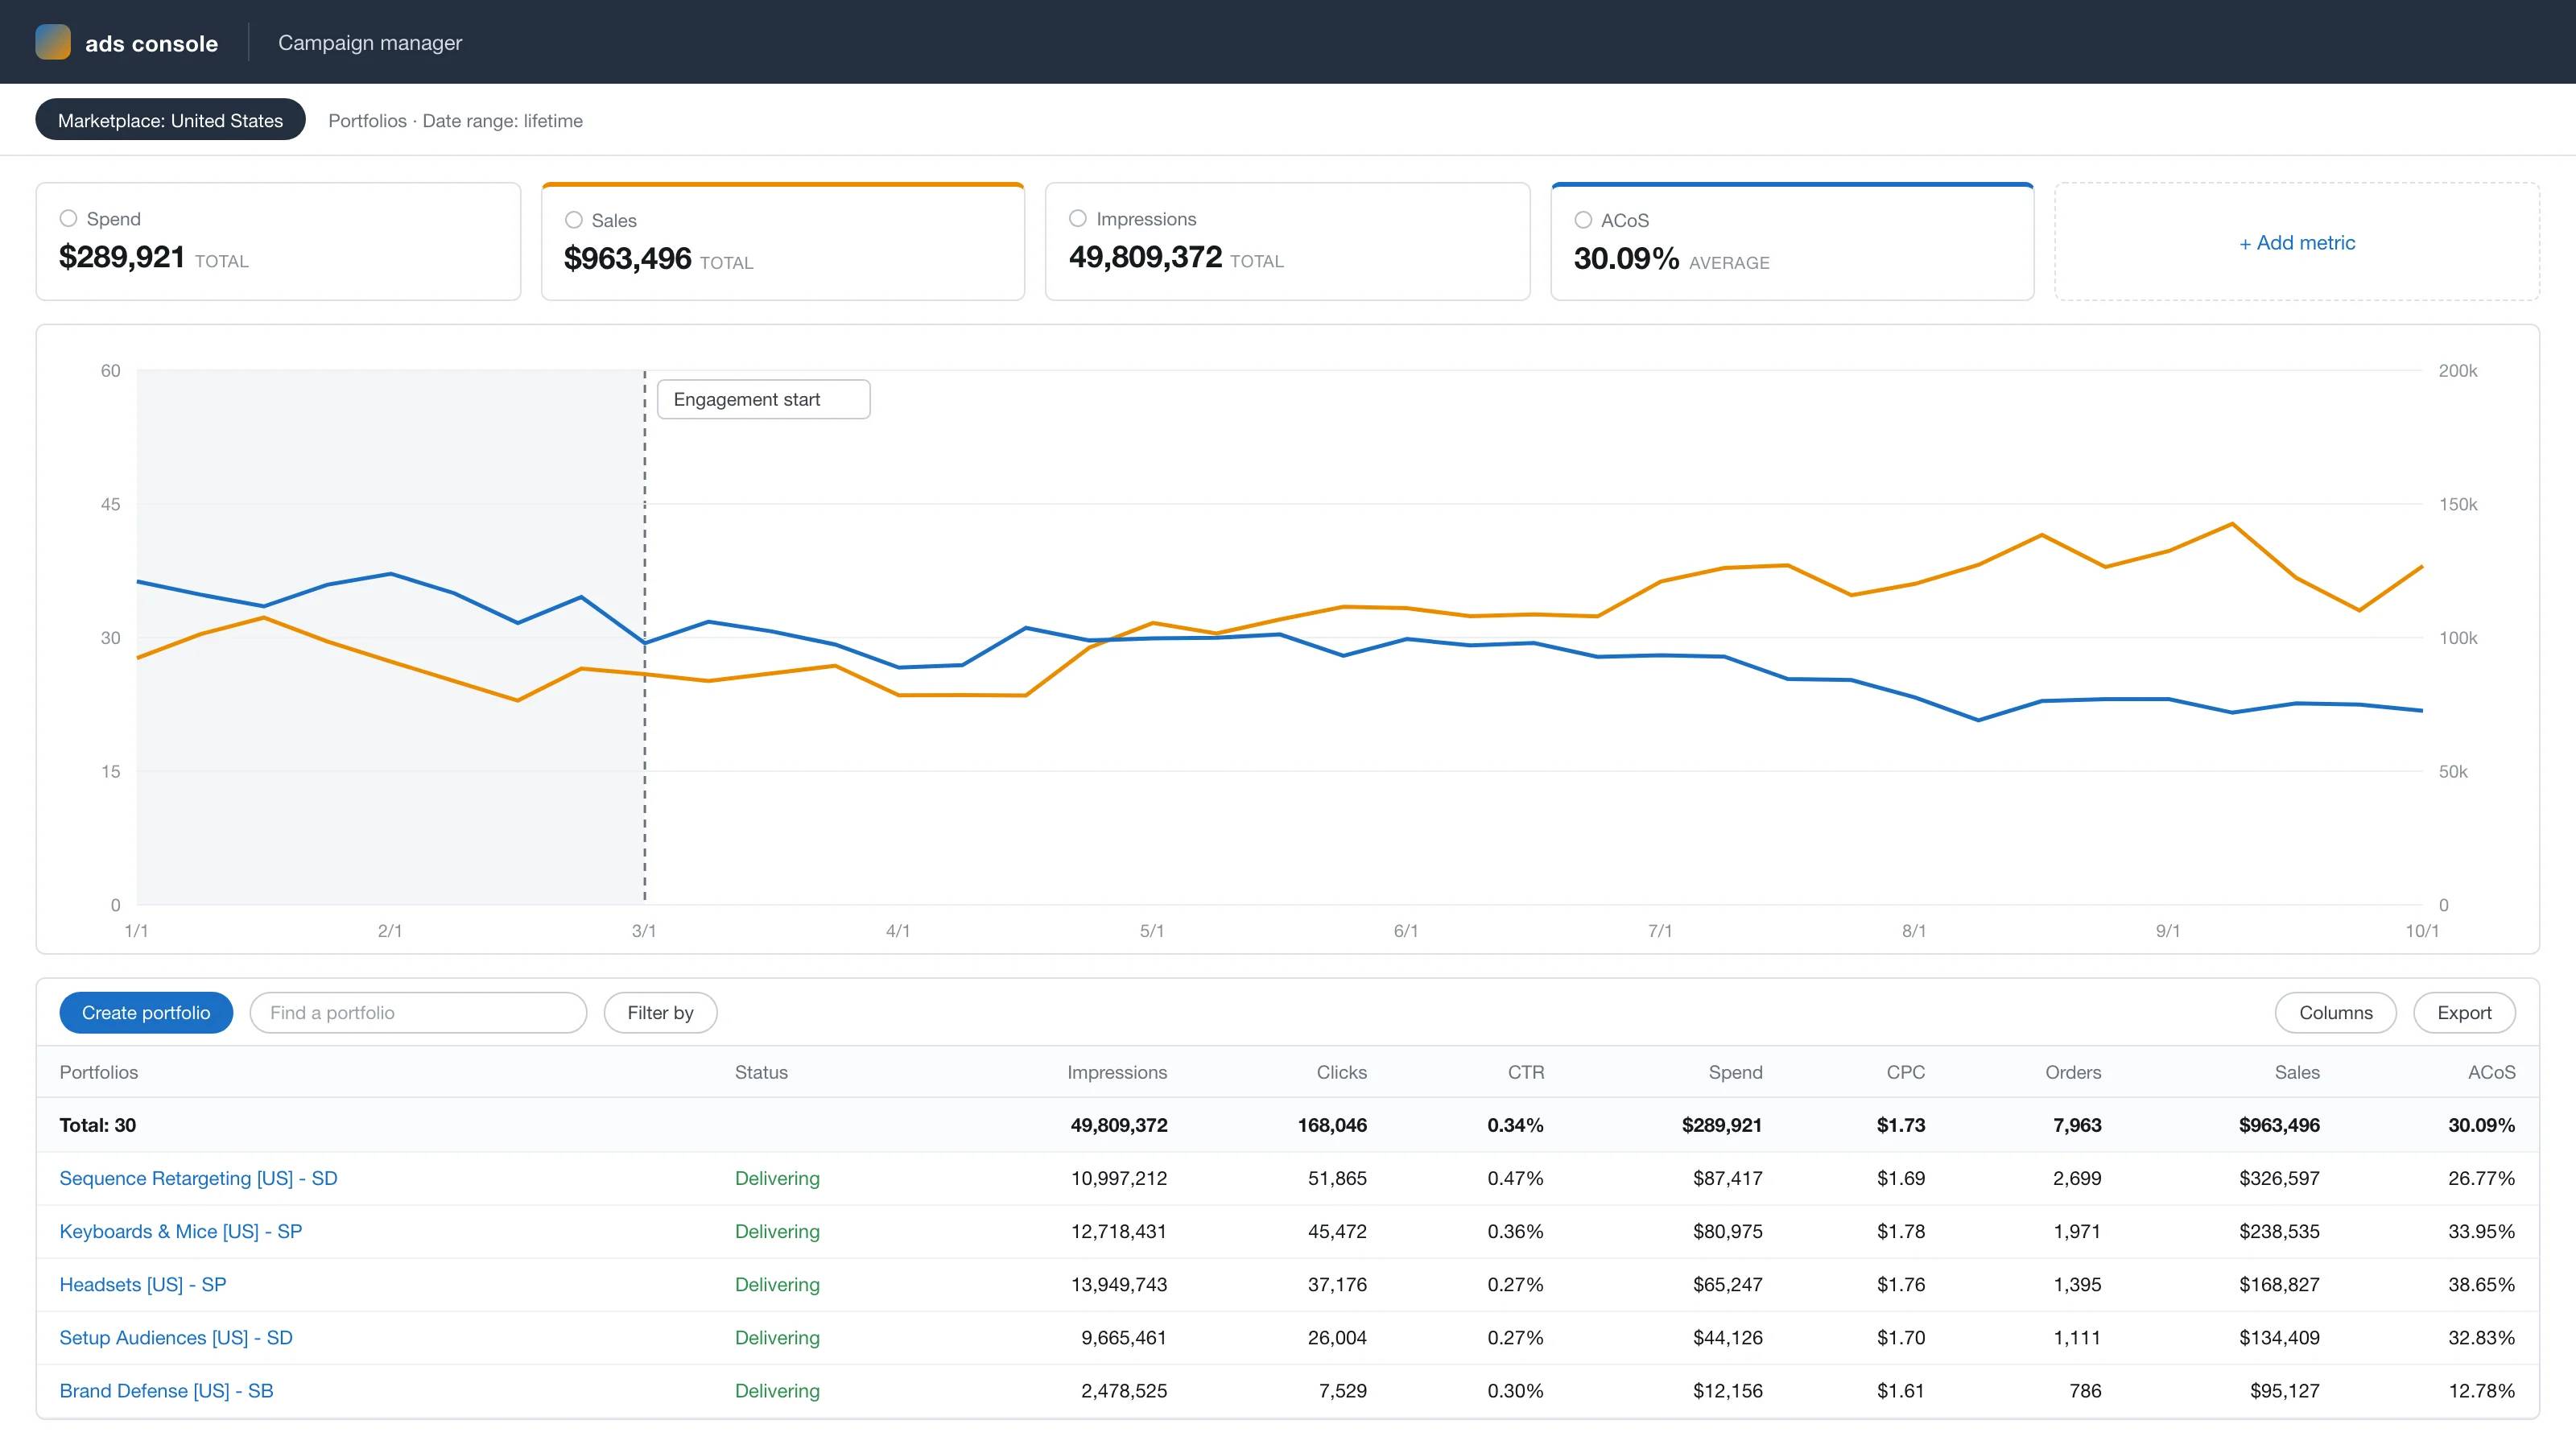
Anonymized account view, rebuilt from the figures reported above: ad sales growing from $84k to $134k a month while ACoS falls from 33% to 23% across the 7-month engagement.
The results
The second-purchase rate went from 9% to 31%, and revenue per customer rose 22%.
That is what lifted total revenue 29% without any increase in Sponsored spend: the brand stopped paying five separate acquisition costs for the same person and started selling the second, third and fourth item to a customer it had already paid for. The nineteen-day gap is now a scheduled flight rather than a coincidence.
“We knew people build setups over time. We just never did anything with that between the first order and never.”
Services we delivered
Related case studies
Ready to scale your Amazon brand?
Talk to a senior strategist and leave with a growth plan for your store — no obligation.